Fig. 3
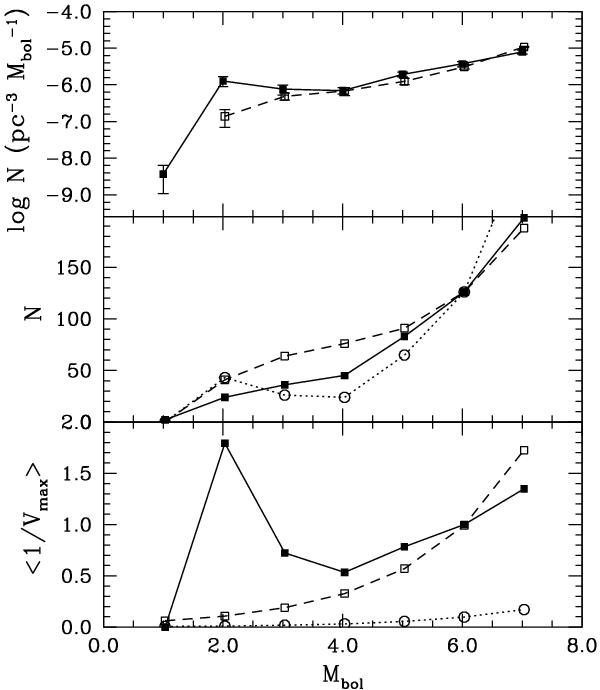
Top panel: luminosity function of DA white dwarfs of Krzesinski et al. (2009) – solid line and filled squares – and our fiducial white dwarf luminosity function – dashed line and empty squares. Middle panel: total number of objects of Krzesinski et al. (2009) – solid line and filled symbols – and that obtained in our fiducial model – dashed line and open squares. In this panel we also plot the antilogarithm of the observed white dwarf luminosity function – dotted line and empty circles. Bottom panel: average contribution per object, as obtained from the data of Krzesinski et al. (2009) and from our population synthesis simulations – dashed line and empty squares. The solid line connecting the filled squares shows the average contribution of DA white dwarfs, while the dotted line connecting the empty circles shows that of non-DA white dwarfs.
Current usage metrics show cumulative count of Article Views (full-text article views including HTML views, PDF and ePub downloads, according to the available data) and Abstracts Views on Vision4Press platform.
Data correspond to usage on the plateform after 2015. The current usage metrics is available 48-96 hours after online publication and is updated daily on week days.
Initial download of the metrics may take a while.