Fig. 10
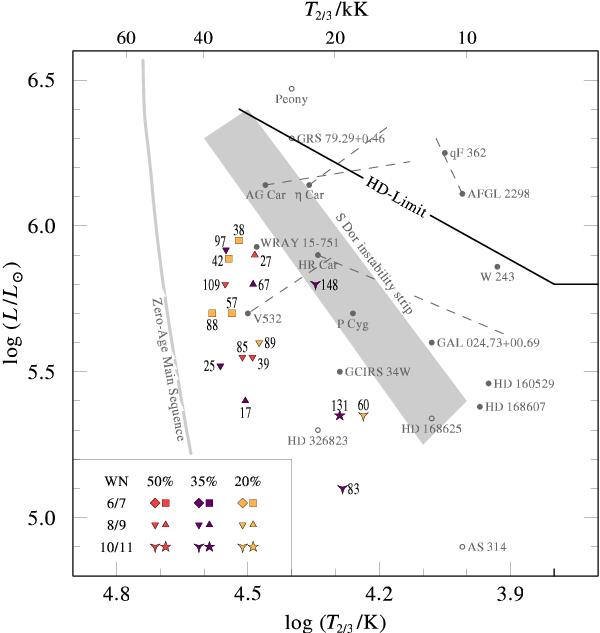
Hertzsprung-Russell diagram based of the M 31 late-WN sample, this time with  instead of T∗. For comparison, known LBVs (filled circles) and LBV candidates (open circles) are shown. The gray-shaded area marks the S Dor instability strip (Wolf 1989). The empirical Humphreys-Davidson limit is also indicated. The parameters of the comparison stars are taken from Nazé et al. (2012) with the exception of Romano‘s Star (V532, Clark et al. 2012; Maryeva & Abolmasov 2012) and the Peony star (Barniske et al. 2008). The locations of LBVs in different stages are connected by dashed lines. Labels without letters refer to the M31WR numbers as listed in Table 2.
Current usage metrics show cumulative count of Article Views (full-text article views including HTML views, PDF and ePub downloads, according to the available data) and Abstracts Views on Vision4Press platform.
Data correspond to usage on the plateform after 2015. The current usage metrics is available 48-96 hours after online publication and is updated daily on week days.
Initial download of the metrics may take a while.