| Issue |
A&A
Volume 563, March 2014
|
|
|---|---|---|
| Article Number | A89 | |
| Number of page(s) | 22 | |
| Section | Stellar atmospheres | |
| DOI | https://doi.org/10.1051/0004-6361/201323240 | |
| Published online | 14 March 2014 | |
Online material
Appendix A: Spectral fits
Appendix overview: analyzed late-type WN stars in M 31.
 |
Fig. A.1
Spectral fit for M31WR 17. |
| Open with DEXTER | |
 |
Fig. A.2
Spectral fit for M31WR 25. |
| Open with DEXTER | |
 |
Fig. A.3
Spectral fit for M31WR 27. |
| Open with DEXTER | |
 |
Fig. A.4
Spectral fit for M31WR 38. |
| Open with DEXTER | |
 |
Fig. A.5
Spectral fit for M31WR 39. |
| Open with DEXTER | |
 |
Fig. A.6
Spectral fit for M31WR 42. |
| Open with DEXTER | |
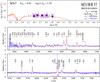 |
Fig. A.7
Spectral fit for M31WR 57. |
| Open with DEXTER | |
 |
Fig. A.8
Spectral fit for M31WR 60. |
| Open with DEXTER | |
 |
Fig. A.9
Spectral fit for M31WR 67. |
| Open with DEXTER | |
 |
Fig. A.10
Spectral fit for M31WR 83. |
| Open with DEXTER | |
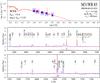 |
Fig. A.11
Spectral fit for M31WR 85. |
| Open with DEXTER | |
 |
Fig. A.12
Spectral fit for M31WR 88. |
| Open with DEXTER | |
 |
Fig. A.13
Spectral fit for M31WR 89. |
| Open with DEXTER | |
 |
Fig. A.14
Spectral fit for M31WR 97. |
| Open with DEXTER | |
 |
Fig. A.15
Spectral fit for M31WR 109. |
| Open with DEXTER | |
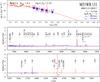 |
Fig. A.16
Spectral fit for M31WR 131. |
| Open with DEXTER | |
 |
Fig. A.17
Spectral fit for M31WR 148. |
| Open with DEXTER | |
Appendix B: Problematic objects
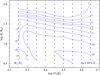 |
Fig. B.1
Contours of constant equivalent width Wλ for He i 5876 Å in the WNh model grid with XH = 0.2 and ν∞ = 500 km s-1. A positive value indicates an absorption line, negative values refer to emission lines. |
| Open with DEXTER | |
Appendix B.1: M31WR 60
For the WN10 star #60 (J004242.33+413922.7), we could not reproduce the peak heights of the unusually strong He i lines. Looking into the model grids reveals that there seems to be a maximum for the He i emission lines that cannot be superseded for a given temperature (and chemical composition), even if we further increase the mass-loss rate. This is illustrated in Fig. B.1 where we plot contours of constant equivalent width Wλ for one of our WNh grids. The temperature T∗ is fixed by He ii 4686 Å and N iii 4634/42 Å, which are reproduced well in our fit (cf. Fig. A.8).
For #60, we therefore focused on the smaller emission lines that are mostly reproduced. The best result is obtained for a model with 20% hydrogen, even though the Hβ, Hγ, and Hδ lines
are slightly too weak in the model. However, models with 35% hydrogen or more do not lead to a better fit of the whole spectrum.
Appendix B.2: M31WR 42
Another problematic object is #42, alias J004130.37+410500.9. This spectrum is highly contaminated with strong nebular emission. Massey et al. (2007) refrained from assigning a subtypes and listed the star simply as WNL. Neugent et al. (2012) speculated that it might be of WN7 subtype, but have not included this in their table either. Unfortunately the observed spectrum ends at 6000 Å so that Hα is not covered. Only two prominent WN features are available for the diagnostic, N iii 4634/42 Å and He ii 4686 Å, both in emission. Indeed the roughly similar peak heights of these two lines would classify the star as WN7 following the scheme of van der Hucht (2001), but since N iv is so weak in the spectrum, it could also be classified as WN8. However, we do not see strong P-Cyg-profiles that would be another criterion for the WN8 subtype. We therefore specify the subtype as WN7-8 until future observations become available.
From the two diagnostic lines we can obtain the basic parameters T∗ and Rt for #42. Owing to the strong nebular emission lines, the hydrogen content XH and the terminal velocity ν∞ are harder to determine. From the unblended lines, neither the N iii-complex at 4634−42 Å nor the weak He ii 4686 Å line are really sensitive to ν∞. We therefore use the H i and He i lines, although they are polluted with nebular emission. We can rule out velocities higher than ν∞ = 500 km s-1 because they would produce line profiles that are broader than the observed lines. The best compromise is obtained with ν∞ = 300 km s-1, which would favor WN8 over the WN7 subtype classification, where we usually find higher terminal velocities.
For the hydrogen content, we use the indirect sensitivity of He ii 4686 Å to rule out models with 50% hydrogen and zero hydrogen. We favor a model with 20% over those with 35% hydrogen because we observe a small emission of C iii 4650 Å and therefore expect a more “evolved” star, but a larger uncertainty than for the other objects remains.
© ESO, 2014
Current usage metrics show cumulative count of Article Views (full-text article views including HTML views, PDF and ePub downloads, according to the available data) and Abstracts Views on Vision4Press platform.
Data correspond to usage on the plateform after 2015. The current usage metrics is available 48-96 hours after online publication and is updated daily on week days.
Initial download of the metrics may take a while.