Fig. 1
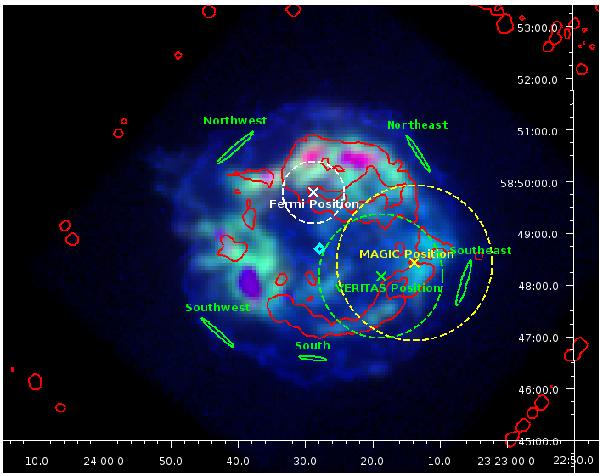
Multi-colour image (Dec vs. RA in J2000) of Cas A produced using Chandra X-ray data. The red, green, and blue colour hues represent the energy ranges of [0.7, 1.0], [1.0, 3.5], and [3.5, 8.0] keV, respectively. The red and green hues are smoothed in linear colour scale, while the blue hues are shown in logarithmic scale to enhance the view of the smallest number of X-ray counts existing in the outer shell. The green ellipses represent the S, SW, SE, NW, and NE of the shell. The green and yellow crosses and dashed circles correspond to the VERITAS and MAGIC locations and approximated location error circles. The white cross and dashed circle are for the GeV gamma-ray emission best-fit location and the location error circle from the analysis in this paper. The CCO location is shown with a cyan open diamond. The red contours represent the derived CO data from Spitzer-IRAC starting from a value of 0.4 MJy/sr and higher.
Current usage metrics show cumulative count of Article Views (full-text article views including HTML views, PDF and ePub downloads, according to the available data) and Abstracts Views on Vision4Press platform.
Data correspond to usage on the plateform after 2015. The current usage metrics is available 48-96 hours after online publication and is updated daily on week days.
Initial download of the metrics may take a while.