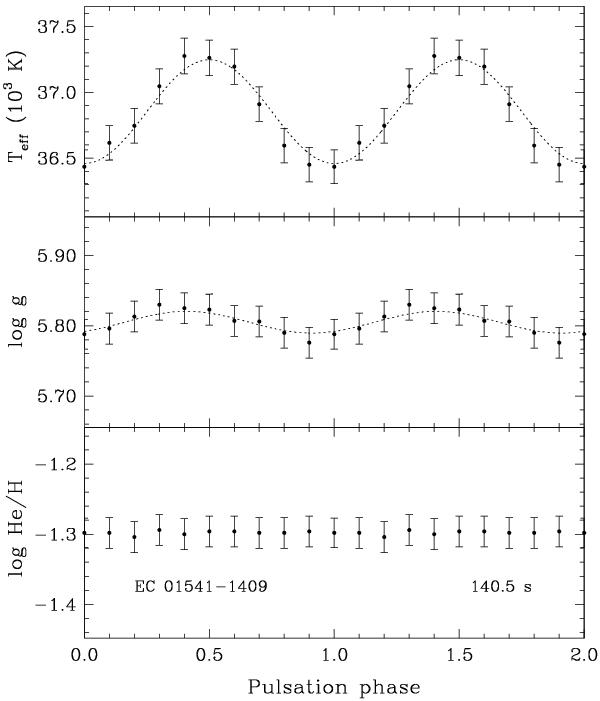
Fig. 8

Apparent variations in atmospheric parameters over the pulsation phase for the dominant period in EC 01541−1409. The points with error bars show the values of Teff (top panel), log g (middle panel), and log N(He)/N(H) (bottom panel) as derived from our model atmosphere fit to 10 spectra phase-binned to the 140.5 s periodicity (see text for details). Two pulsation cycles are shown for better visualisation. The dashed curves correspond to the phase-dependent Teff and log g as predicted from the respective amplitudes and equilibrium values listed in Table 5. The noticeable difference in phase between the Teff and the log g variations is due to non-adiabatic effects and corresponds to the departure from the adiabatic value (0.25 pulsation cycles) of the phase lag between the flux and RV variation reported in Table 4, i.e. 0.09 cycles.
Current usage metrics show cumulative count of Article Views (full-text article views including HTML views, PDF and ePub downloads, according to the available data) and Abstracts Views on Vision4Press platform.
Data correspond to usage on the plateform after 2015. The current usage metrics is available 48-96 hours after online publication and is updated daily on week days.
Initial download of the metrics may take a while.


