Fig. 4
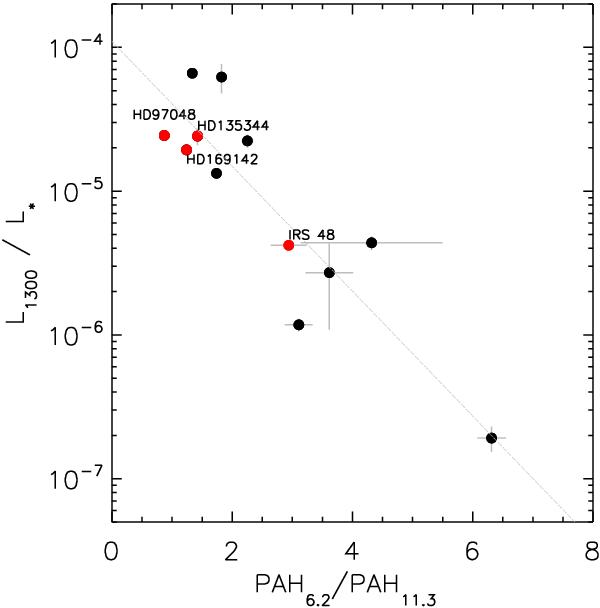
An observational trend between the I6.2/I11.3 ratio as a function of the luminosity at 1.3 mm (L1300/L∗). The red dots show the objects studied in this paper. The gray line gives the best fit to the data (Eq. (1)). The parameters of all the objects are listed in Table 1. For high mm luminosities, the I6.2/I11.3 ratio is lowest (tracing neutral PAHs), while the I6.2/I11.3 ratio is highest (tracing ionized PAHs) for low mm values.
Current usage metrics show cumulative count of Article Views (full-text article views including HTML views, PDF and ePub downloads, according to the available data) and Abstracts Views on Vision4Press platform.
Data correspond to usage on the plateform after 2015. The current usage metrics is available 48-96 hours after online publication and is updated daily on week days.
Initial download of the metrics may take a while.