Fig. 2
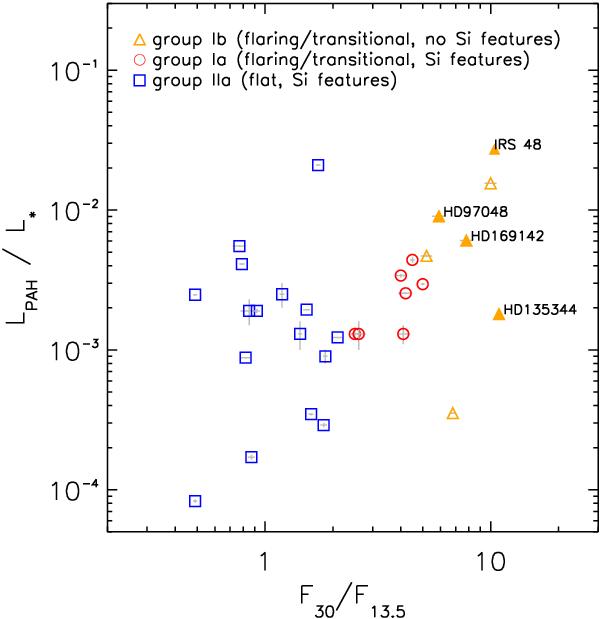
PAH luminosity (LPAH/L∗) of a sample of Herbig stars compared to the MIR spectral index (F30/F13.5). The MIR spectral index can be used as a tracer of disk gaps, as indicated by the symbols showing the flaring/transitional disks (group I) with silicate features (red circles), without silicate features (orange triangles), and self-shadowed disks (group II) with silicate features (blue squares). While the PAH luminosities among the objects span ~2–3 orders of magnitude, the averaged luminosities of the disk groups only differ by a factor of ~2–3. The parameters of all the objects are listed in Table 1.
Current usage metrics show cumulative count of Article Views (full-text article views including HTML views, PDF and ePub downloads, according to the available data) and Abstracts Views on Vision4Press platform.
Data correspond to usage on the plateform after 2015. The current usage metrics is available 48-96 hours after online publication and is updated daily on week days.
Initial download of the metrics may take a while.