Fig. 5
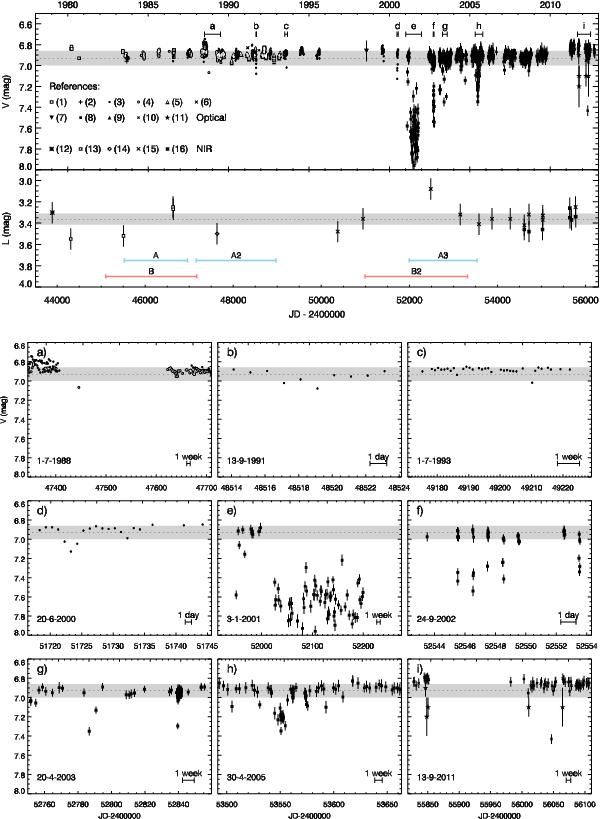
Top: lightcurve of HD 163296 in V (0.55 μm) and L (3.76 μm). The dotted line and the gray shaded areas correspond to the mean value and 1σ spread. The time intervals denoted above the V-band lightcurve are expanded in the bottom panel. Horizontal bars indicate the jet launch epochs estimated from radial velocities (Sect. 3.1). Bottom: V-band lightcurve for selected intervals, exhibiting the shape, duration, and frequency of the fading events. The calendar date corresponding to the minimum value on the x-axis is displayed in the bottom left corner of each graph. References for plot symbols: (1) de Winter et al. (2001); (2) Manfroid et al. (1991); (3) Maidanak Observatory (Grankin et al., in prep.); (4) Swiss (this work); (5) Perryman et al. (1997); (6) Hillenbrand et al. (1992); (7) Eiroa et al. (2001); (8) Pojmanski & Maciejewski (2004); (9) AAVSO (this work); (10) Tannirkulam et al. (2008b); (11) Mendigutía et al. (2013); (12) Sitko et al. (2008); (13) de Winter et al. (2001); (14) Berrilli et al. (1992); (15) BASS; (16) SpeX (Sitko et al. 2008, this work). See Table A.1 for more details.

Current usage metrics show cumulative count of Article Views (full-text article views including HTML views, PDF and ePub downloads, according to the available data) and Abstracts Views on Vision4Press platform.
Data correspond to usage on the plateform after 2015. The current usage metrics is available 48-96 hours after online publication and is updated daily on week days.
Initial download of the metrics may take a while.