Fig. 4
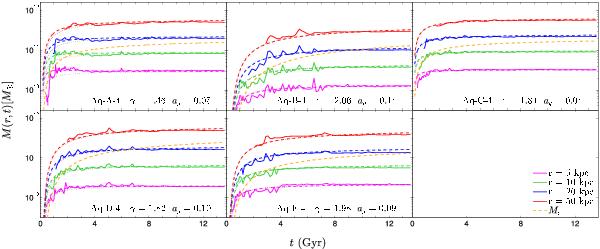
Mass growth history of the Milky Way-like Aquarius halos at different radii compared to the fit obtained using our model for rs and Ms (colour dashed curves) and fitted for z < 6 to avoid the epoch of significant mergers. The dashed orange line indicates the evolution of the scale mass Ms. Setting γ = 2 also gives a reasonable fit as indicated by the dotted grey curve for each halo.
Current usage metrics show cumulative count of Article Views (full-text article views including HTML views, PDF and ePub downloads, according to the available data) and Abstracts Views on Vision4Press platform.
Data correspond to usage on the plateform after 2015. The current usage metrics is available 48-96 hours after online publication and is updated daily on week days.
Initial download of the metrics may take a while.