Fig. 2
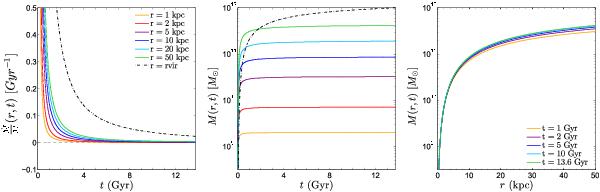
Evolution in time of the same final halo of Fig. 1, but using our new model with ag = 0.04 and γ = 2. Left panel: the relative growth rate does not reach a minimum, nor does it reach negative values. This implies that the shells grow at all times, but as the central panel shows, the mass growth history for the shells flattens out towards the end. The behaviour at the virial radius follows closely (but not exactly) the Wechsler model, as shown by the dash-dotted curve. Right panel: mass profile at different epochs.
Current usage metrics show cumulative count of Article Views (full-text article views including HTML views, PDF and ePub downloads, according to the available data) and Abstracts Views on Vision4Press platform.
Data correspond to usage on the plateform after 2015. The current usage metrics is available 48-96 hours after online publication and is updated daily on week days.
Initial download of the metrics may take a while.