Fig. 1
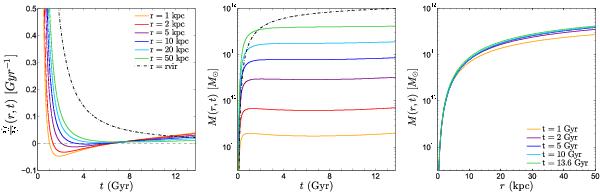
Evolution in time of a halo with virial mass Mvir = 1012 M⊙ and formation epoch ac = 0.15 (for a cosmology with h = 0.7, Ωm = 0.28, and ΩΛ = 0.72) using the Wechsler model. The left panel shows that the mass growth rate reaches a minimum for all shells between t = 1 and t = 7 Gyr, and is negative for the innermost shells, which implies they decrease in mass. The central panel shows the mass history for all shells. The shells show a temporary stall in their growth, or even a decrease in mass, between t = 1 and t = 7 Gyr, before resuming growth again at later times. The right panel shows the mass profile at different epochs.
Current usage metrics show cumulative count of Article Views (full-text article views including HTML views, PDF and ePub downloads, according to the available data) and Abstracts Views on Vision4Press platform.
Data correspond to usage on the plateform after 2015. The current usage metrics is available 48-96 hours after online publication and is updated daily on week days.
Initial download of the metrics may take a while.