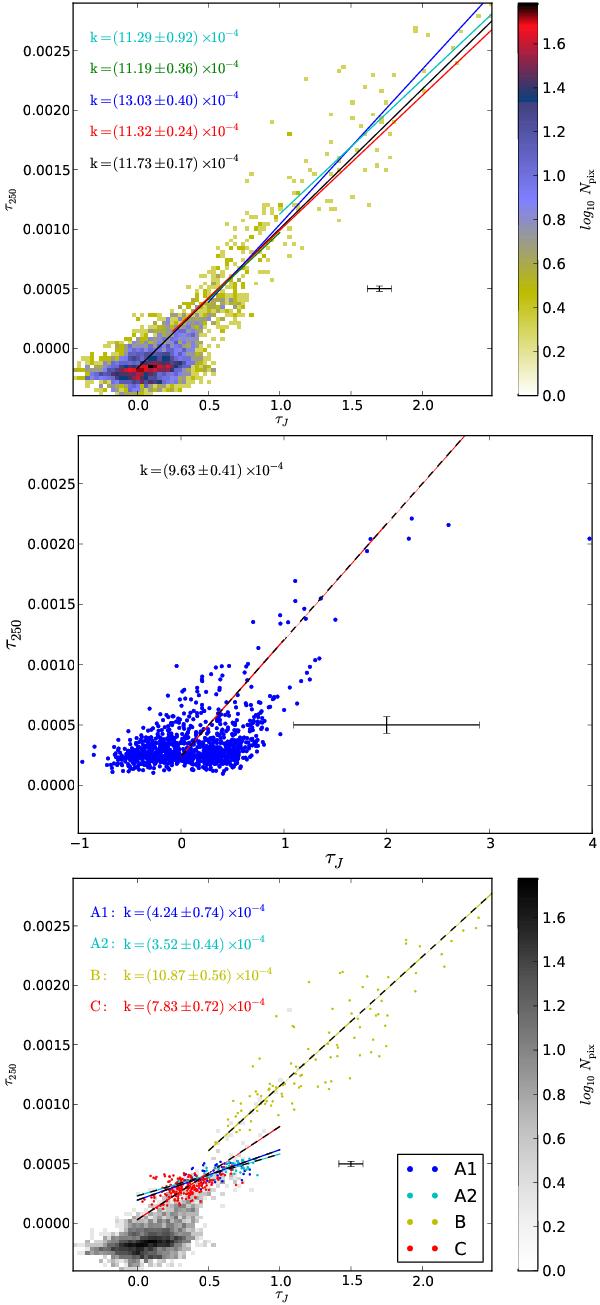
Fig. 5

(Top) Relation between τ250 and τJ. The line length shows the τJ range used in the total least squares fitting. The slopes (k) of the fits are indicated on the plot with the same colour as the fitted line. The ranges used are 0–2.5 (black), 0.25–2.5 (red), 0.5–2.5 (blue), 0.5–1 (green), and 1–2.5 (cyan). (Middle) Relation between τ250 (with resolution 40″) and τJ of individual stars, using a limit ΔτJ < 0.95. (Bottom) Relation between τ250 and τJ. The data of each region are fitted separately. The slope k and the mean error bars are indicated on the plots. The colour scales in the top and bottom panels correspond to the logarithmic density of points.
Current usage metrics show cumulative count of Article Views (full-text article views including HTML views, PDF and ePub downloads, according to the available data) and Abstracts Views on Vision4Press platform.
Data correspond to usage on the plateform after 2015. The current usage metrics is available 48-96 hours after online publication and is updated daily on week days.
Initial download of the metrics may take a while.


