Fig. 4
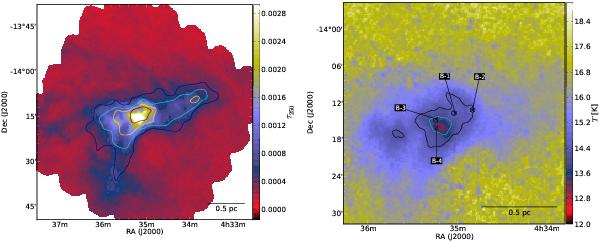
Maps derived by MCMC fitting with a constant β = 1.8, using Herschel 250–500 μm maps at 40″ resolution. Background is not subtracted from the maps. (Left) Optical depth τ250 with contours of column density NH2 derived from 13CO observations of Russeil et al. (2003) drawn at levels 4, 3, 2, and 1 × 1021 cm-2. (Right) Colour temperature T with contours of the τ250 map drawn at levels 0.0035, 0.0029, and 0.0017. Sources B-1, B-2, B-3, and B-4 are marked with crosses (Getsources coordinates) and circles (WISE coordinates).
Current usage metrics show cumulative count of Article Views (full-text article views including HTML views, PDF and ePub downloads, according to the available data) and Abstracts Views on Vision4Press platform.
Data correspond to usage on the plateform after 2015. The current usage metrics is available 48-96 hours after online publication and is updated daily on week days.
Initial download of the metrics may take a while.