Fig. 3
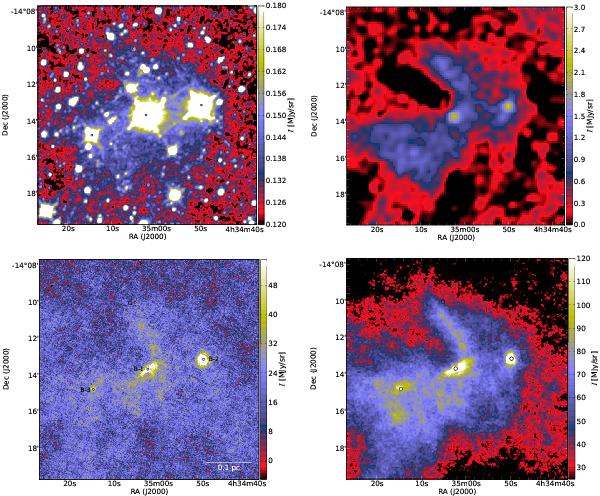
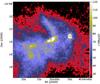
WISE 3.4 μm and AzTEC/ASTE 1.1 mm intensity maps (top row). Herschel 100 and 160 μm intensity maps (without zero-point correction) at the original resolution (7″ and 12″, respectively, bottom row). The sources B-1, B-2, B-3, and G (see text) are marked on the Herschel and WISE maps, using their 2MASS coordinates. The marker circles show the beam FWHM.
Current usage metrics show cumulative count of Article Views (full-text article views including HTML views, PDF and ePub downloads, according to the available data) and Abstracts Views on Vision4Press platform.
Data correspond to usage on the plateform after 2015. The current usage metrics is available 48-96 hours after online publication and is updated daily on week days.
Initial download of the metrics may take a while.