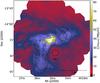
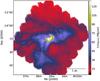
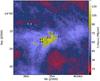
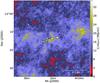
Fig. 2
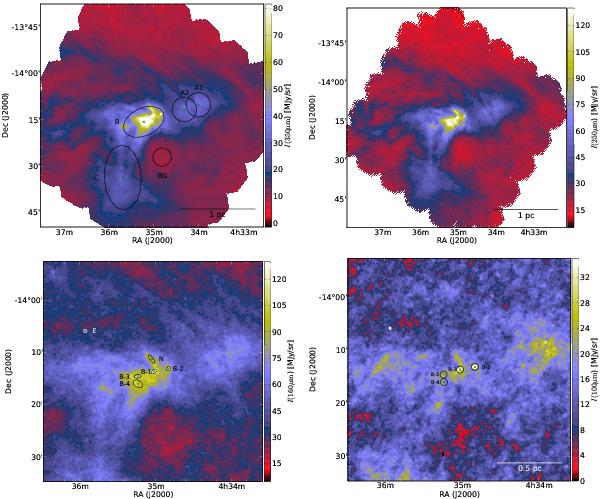
Herschel intensity maps showing the areas used in the analysis. The maps show the total intensity after zero-point correction. (Top left) 350 μm (26.8″ resolution) showing the larger regions (A1, A2, B and C) and the background area (BG) used in the analysis. (Top right) 250 μm (18.3″ resolution) map showing the striation in L1642. (Bottom left) 160 μm (18.3″ resolution) showing the most prominent clumps identified by Getsources. FWHM ellipses of the clumps are drawn in the figure. (Bottom right) 100 μm (18.3″ resolution) showing the circular apertures (with 80″ diameter) used in the aperture photometry of the point sources marked in the figure.
Current usage metrics show cumulative count of Article Views (full-text article views including HTML views, PDF and ePub downloads, according to the available data) and Abstracts Views on Vision4Press platform.
Data correspond to usage on the plateform after 2015. The current usage metrics is available 48-96 hours after online publication and is updated daily on week days.
Initial download of the metrics may take a while.