Fig. D.1
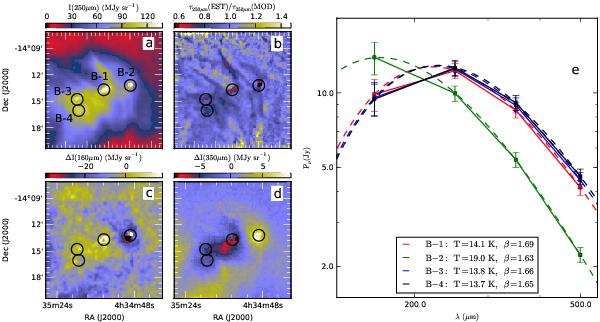
Analysis of model surface brightness and optical depth. Panel a) shows the 250 μm surface brightness and the apertures used for flux measurements of sources B-1, B-2, B-3, and B-4. Panel b) shows the ratio of optical depths that are estimated from synthetic surface brightness data and the actual 250 μm optical depth of the model cloud. Panels c) and d) show the residuals between the actual Herschel observations and the model predictions at 160 μm and 350 μm, respectively. Panel e) shows the SEDs derived for the sources using the model-predicted intensities and quotes the results of the MBB fits.
Current usage metrics show cumulative count of Article Views (full-text article views including HTML views, PDF and ePub downloads, according to the available data) and Abstracts Views on Vision4Press platform.
Data correspond to usage on the plateform after 2015. The current usage metrics is available 48-96 hours after online publication and is updated daily on week days.
Initial download of the metrics may take a while.