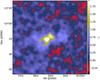
Fig. A.3
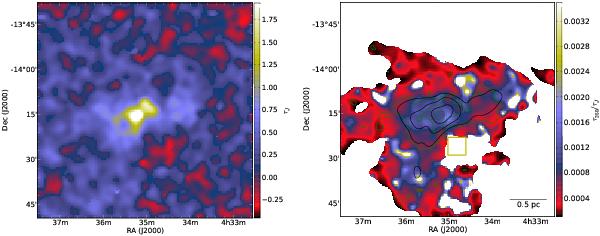
(Left) Optical depth τJ map derived from 2MASS data. The resolution of the map is 180″. (Right) τ250/τJ map with resolution 180″. The black contours are drawn on τ250 levels 0.0016, 0.0008, and 0.0004. The green contours are drawn on τJ levels 2, 1, and 0.5. Areas where τJ < 0.0001 or τ250 < 0.00004 are masked. The area marked with a yellow rectangle was used as a background when subtracting the background from the two optical depth maps.
Current usage metrics show cumulative count of Article Views (full-text article views including HTML views, PDF and ePub downloads, according to the available data) and Abstracts Views on Vision4Press platform.
Data correspond to usage on the plateform after 2015. The current usage metrics is available 48-96 hours after online publication and is updated daily on week days.
Initial download of the metrics may take a while.