Fig. A.2
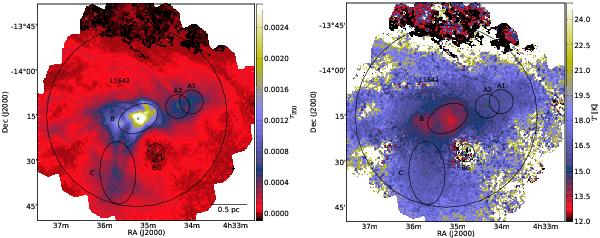
Maps derived by MCMC fitting with a constant β = 1.8, using Herschel 250–500 μm maps at 40″ resolution. The maps are based on background-subtracted intensity maps, using the area marked BG as background. Areas of the clumps A1, A2, B, and C, and the main part of cloud (marked L1642) used in the analysis. The maps are τ250 (left) and T (right).
Current usage metrics show cumulative count of Article Views (full-text article views including HTML views, PDF and ePub downloads, according to the available data) and Abstracts Views on Vision4Press platform.
Data correspond to usage on the plateform after 2015. The current usage metrics is available 48-96 hours after online publication and is updated daily on week days.
Initial download of the metrics may take a while.