Fig. 12
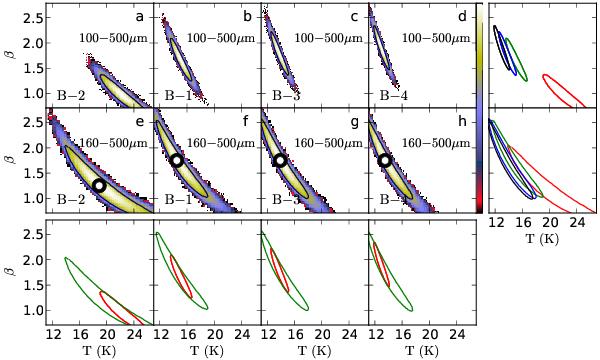
The (T, β) probability distributions calculated for sources B-1, B-2, B-3, and B-4 using the MCMC method. The contours correspond to 90% confidence regions. The black circles indicate the maximum-likelihood solutions that were obtained with Herschel data in the range 160–500 μm. The contours of all cases are shown in the rightmost column and bottom row, similarly as in Fig. 11.
Current usage metrics show cumulative count of Article Views (full-text article views including HTML views, PDF and ePub downloads, according to the available data) and Abstracts Views on Vision4Press platform.
Data correspond to usage on the plateform after 2015. The current usage metrics is available 48-96 hours after online publication and is updated daily on week days.
Initial download of the metrics may take a while.