Fig. 11
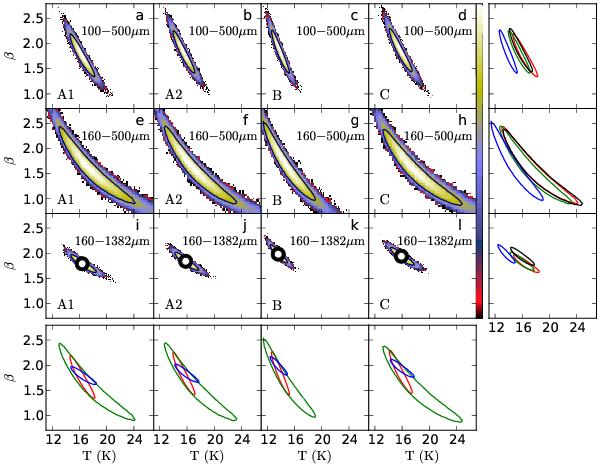
(T,β) probability distributions calculated for areas A1, A2, B, and C with the MCMC method. Each column corresponds to one of the areas and the rows to different wavelength ranges used in the MBB fits. The contours correspond to the 90% confidence regions. The maximum-likelihood solutions obtained by combining Herschel and Planck observations are shown as black circles. The 90% contours for all cases in the same column or row are shown in the last column or row, respectively. The contour colours are red, green, blue, and black, from left to right or from top to bottom.
Current usage metrics show cumulative count of Article Views (full-text article views including HTML views, PDF and ePub downloads, according to the available data) and Abstracts Views on Vision4Press platform.
Data correspond to usage on the plateform after 2015. The current usage metrics is available 48-96 hours after online publication and is updated daily on week days.
Initial download of the metrics may take a while.