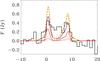
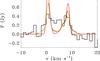
Fig. 8

Results of H2CO abundance models: spectra integrated over the emission rectangle of the observations for different abundances for model 1 (purple), model 2 (green), and model 3 (red) for abundances 10-7 (dashed), 10-8 (solid), and 10-9 (dotted). The black spectrum represents the observational data. Abundances for model 2 are multiplied with 10-4 to translate the abundance w.r.t. CO to H2. The top figure shows the original models. The bottom figure shows the model spectra scaled to match the total flux of the observations.
Current usage metrics show cumulative count of Article Views (full-text article views including HTML views, PDF and ePub downloads, according to the available data) and Abstracts Views on Vision4Press platform.
Data correspond to usage on the plateform after 2015. The current usage metrics is available 48-96 hours after online publication and is updated daily on week days.
Initial download of the metrics may take a while.