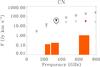
Fig. 13
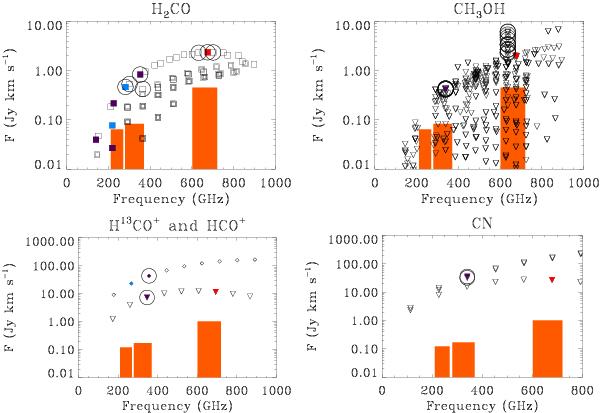
Model predictions for the integrated fluxes for H2CO (both ortho and para lines, assuming an ortho/para ratio of 3), and upper limits for A-CH3OH, H13CO+, HCO+ (triangles and diamonds, respectively), and CN based on our best-fit models for detections and upper limits. The boxes show the 3σ upper limit of the ALMA sensitivity for Band 6 (230 GHz), Band 7 (345 GHz), and Band 9 (690 GHz), integrated over the line profile for one hour integration in the full array. The targeted lines in observations are indicated in red (this study), blue (Öberg et al. 2010, 2011), and purple (Thi et al. 2004). The lines that have the best potential for observation compared with the ALMA sensitivity are encircled.
Current usage metrics show cumulative count of Article Views (full-text article views including HTML views, PDF and ePub downloads, according to the available data) and Abstracts Views on Vision4Press platform.
Data correspond to usage on the plateform after 2015. The current usage metrics is available 48-96 hours after online publication and is updated daily on week days.
Initial download of the metrics may take a while.