Fig. 9
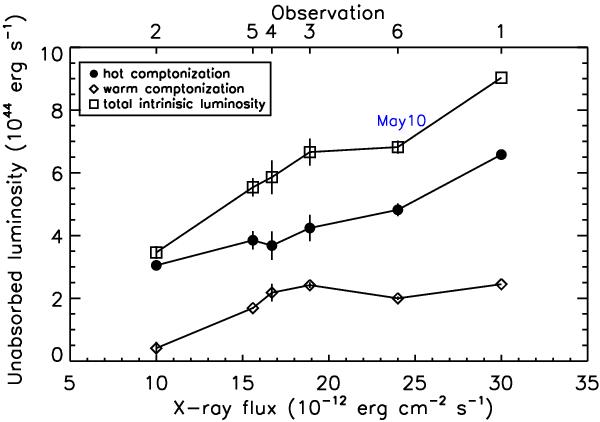
Variability of the intrinsic 0.5–10.0 keV luminosity in1H 0419–577. The unabsorbed luminosities of the hot and the warm Comptonized component, along with the total intrinsic luminosities are plotted against the observed source flux in the 0.5–10.0 keV band. The symbols are outlined in the legend. Error bars, when larger than the size of the plotted symbols, are also shown. The values for the present dataset are labeled and the observation numbers for each data point (see Table 1) are labeled as well on the upper axis.
Current usage metrics show cumulative count of Article Views (full-text article views including HTML views, PDF and ePub downloads, according to the available data) and Abstracts Views on Vision4Press platform.
Data correspond to usage on the plateform after 2015. The current usage metrics is available 48-96 hours after online publication and is updated daily on week days.
Initial download of the metrics may take a while.