Fig. 6
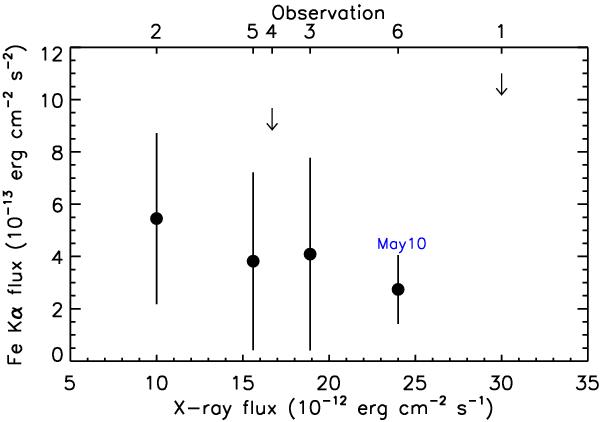
Historical and present observed fluxes of theFe Kαemission line with errors as a function of the source flux in the 0.5–10.0 keV band. The arrows represent upper limits for the line flux. The value for the present dataset is labeled, and the observation numbers for each data point (see Table 1) are labeled as well on the upper axis.
Current usage metrics show cumulative count of Article Views (full-text article views including HTML views, PDF and ePub downloads, according to the available data) and Abstracts Views on Vision4Press platform.
Data correspond to usage on the plateform after 2015. The current usage metrics is available 48-96 hours after online publication and is updated daily on week days.
Initial download of the metrics may take a while.