Free Access
Fig. 9
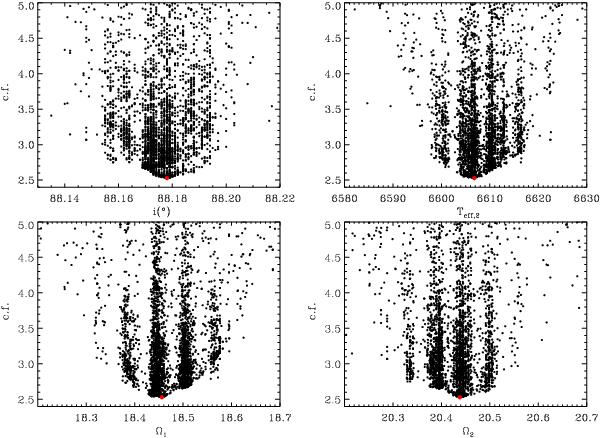
Blow up of the PIKAIA results: cost function value vs. inclination (top left), secondary temperature (top right), and potentials (bottom panels). The minimum value is indicated by a gray (red in the electronic version) larger dot.
Current usage metrics show cumulative count of Article Views (full-text article views including HTML views, PDF and ePub downloads, according to the available data) and Abstracts Views on Vision4Press platform.
Data correspond to usage on the plateform after 2015. The current usage metrics is available 48-96 hours after online publication and is updated daily on week days.
Initial download of the metrics may take a while.