Free Access
Fig. 7
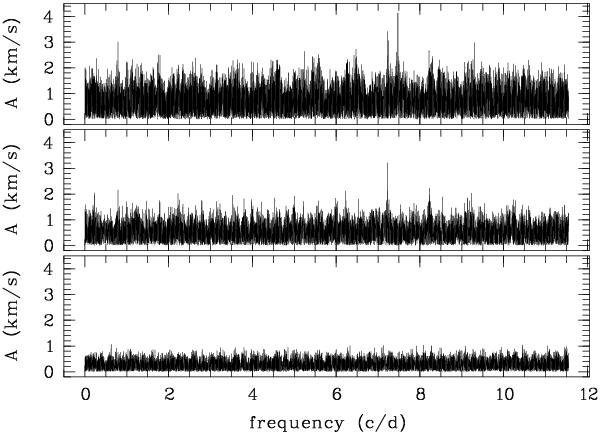
Amplitude spectra, based on our complete dataset of 83 spectra. From top to bottom: original data, largest peak f1; f1 subtracted, largest peak f2; f1 and f2 subtracted.
Current usage metrics show cumulative count of Article Views (full-text article views including HTML views, PDF and ePub downloads, according to the available data) and Abstracts Views on Vision4Press platform.
Data correspond to usage on the plateform after 2015. The current usage metrics is available 48-96 hours after online publication and is updated daily on week days.
Initial download of the metrics may take a while.