Fig. 11
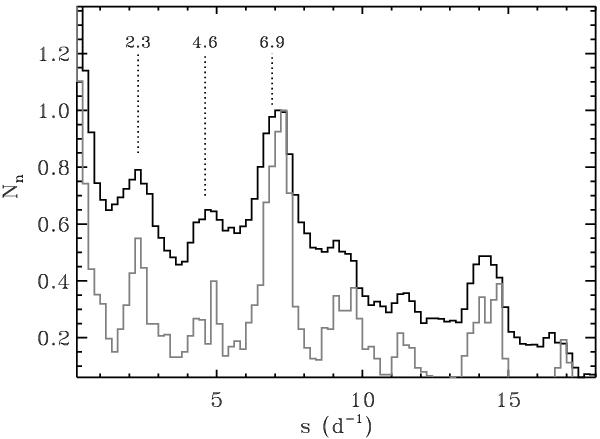
Distribution of differences among the detected frequencies (every frequency was subtracted from all the others and the plot is restricted to the positive values). For easier comparison, each histogram is normalized to the local maximum around 7 d-1. The black line refers to the whole set of 403 frequencies, the gray line to those with amplitude larger than 10-4. The histograms show that there is a preferred spacing around 2.3 d-1, which is clearly visible in both distributions. According to Breger et al. (2009), the spacing corresponds to spacing between radial modes. The multiples of the spacing are also indicated by dotted lines.
Current usage metrics show cumulative count of Article Views (full-text article views including HTML views, PDF and ePub downloads, according to the available data) and Abstracts Views on Vision4Press platform.
Data correspond to usage on the plateform after 2015. The current usage metrics is available 48-96 hours after online publication and is updated daily on week days.
Initial download of the metrics may take a while.