Fig. 3
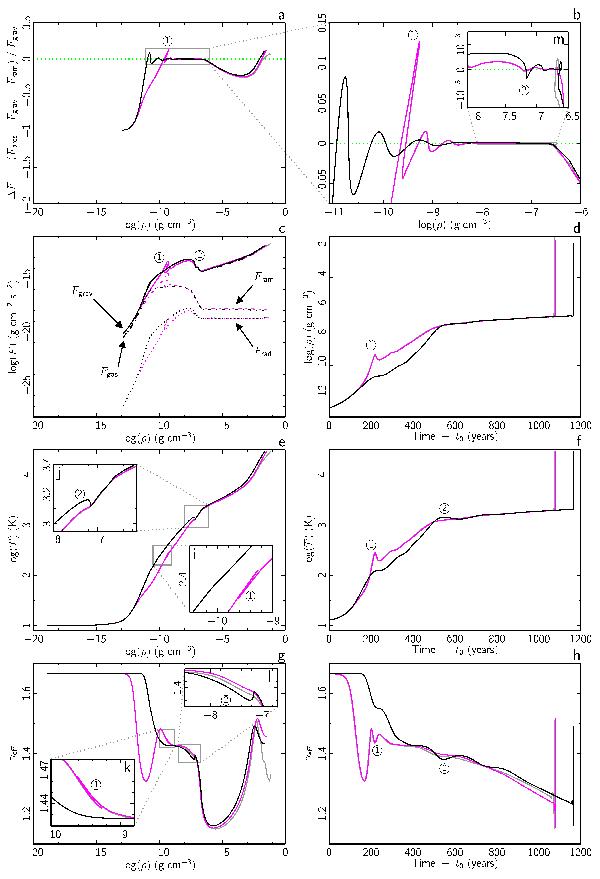
Evolutions of the collapsing systems as a function of central density and time using EOS A (black), EOS B (magenta), and EOS C (grey). a), b) Normalised force differential ΔF between total pressure Fpres, gravity Fgrav, and ram pressure Fram (integrated over the volume of the first core) as a function of central density. The green dotted ΔF = 0 line represents hydrostatic equilibrium. c) The separate force components from gravity Fgrav (solid), gas pressure Fgas (dashed), radiation pressure Frad (dotted), and ram pressure Fram (dot-dash) as a function of central density. d) Central density as a function of time. e) Central temperature as a function of central density. f) Central temperature as a function of time. g) Adiabatic index along the thermal tracks from panel e). h) Adiabatic index at the centre of the grid as a function of time. The time of first core formation t0 is assumed to be when the central density reaches 10-13 g cm-3. In all panels, two thermal bounces are labelled ① and ② (see text).
Current usage metrics show cumulative count of Article Views (full-text article views including HTML views, PDF and ePub downloads, according to the available data) and Abstracts Views on Vision4Press platform.
Data correspond to usage on the plateform after 2015. The current usage metrics is available 48-96 hours after online publication and is updated daily on week days.
Initial download of the metrics may take a while.