Fig. 2
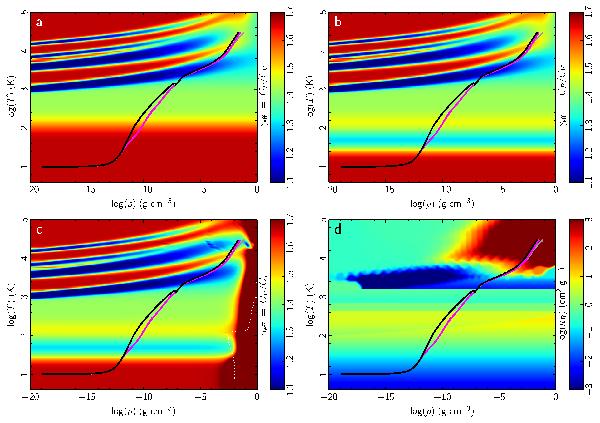
Thermal evolution using EOS A (black; 3:1 OPR), EOS B (magenta; equilibrium OPR), and EOS C (grey; Saumon et al. 1995). The effective ratio of specific heats γeff is displayed in colour in the background for EOSs A, B, and C in panels a), b), and c), respectively. The region in the lower right corner of panel c) delineated by the dotted white line indicates the area of the (ρ,T) space where the values in the EOS table cannot be trusted. In panel d), the Rosseland mean opacity displayed in the background.
Current usage metrics show cumulative count of Article Views (full-text article views including HTML views, PDF and ePub downloads, according to the available data) and Abstracts Views on Vision4Press platform.
Data correspond to usage on the plateform after 2015. The current usage metrics is available 48-96 hours after online publication and is updated daily on week days.
Initial download of the metrics may take a while.