Fig. 8
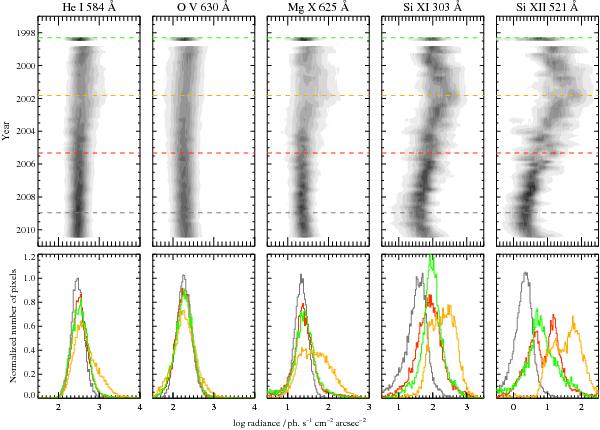
The contours in the upper panels show the time variability of full-disk histograms from CDS USUN mosaics after correction from centre-to-limb variation. The horizontal lines mark representative dates: 23 April 1998 (green), 30 October 2001 (orange), 1 May 2005 (red), and 15 December 2008 (grey). The gap in 1998 is due to the loss of contact of SOHO. The lower panels show the corresponding radiance histograms with the same colour coding. All the histograms are normalised to the total number of pixels; those shown in the lower panels are then also normalised to the peak of the average histogram at the solar minimum of activity.
Current usage metrics show cumulative count of Article Views (full-text article views including HTML views, PDF and ePub downloads, according to the available data) and Abstracts Views on Vision4Press platform.
Data correspond to usage on the plateform after 2015. The current usage metrics is available 48-96 hours after online publication and is updated daily on week days.
Initial download of the metrics may take a while.