Fig. 5
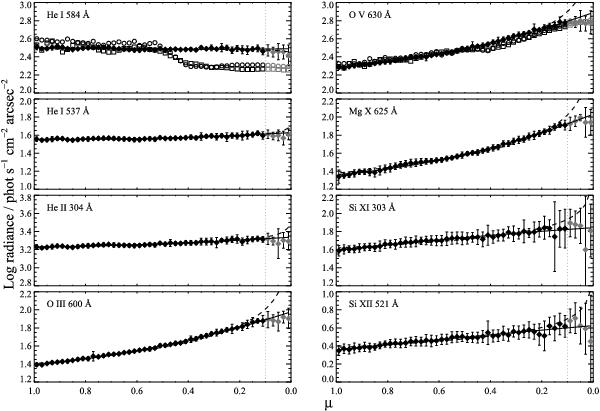
Average centre-to-limb variation in several strong lines from USUN mosaics (diamonds). For the He i 584 Å and O v 630 Å, where SYNOP data are available, squares indicate SYNOP data during the 2007–2009 solar minimum, while circles denote data during the 1996–1997 minimum. The quadratic (solid lines) and power-law (dashed lines) fits to the USUN data are also shown. Grey points (μ < 0.1) indicate data not used in the actual fits.
Current usage metrics show cumulative count of Article Views (full-text article views including HTML views, PDF and ePub downloads, according to the available data) and Abstracts Views on Vision4Press platform.
Data correspond to usage on the plateform after 2015. The current usage metrics is available 48-96 hours after online publication and is updated daily on week days.
Initial download of the metrics may take a while.