Fig. 4
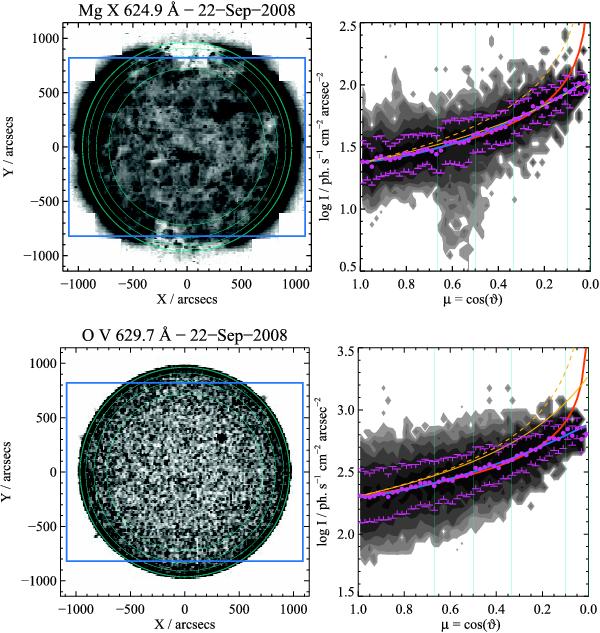
Maps of Mg x 625 Å and O v 630 Å radiances (left-hand panels) in a logarithmic, inverted scale (brighter areas correspond to fainter line radiances) from a USUN mosaic obtained on September 2008. The corresponding bi-dimensional histograms vs. μ are shown in the upper-right and lower-right panel, respectively; the position and width of the histogram peaks are also shown (magenta dots and tee-shaped symbols). The power-law and quadratic curves fitting the peaks of the log I vs. μ histograms are shown as red and blue lines, respectively. Curves derived from plane-parallel and spherical optically thin models are shown as dashed and continuous orange lines, respectively, in both right-hand panels. Distances corresponding to μ = 0 (white light limb), 1/10, 1/3, 1/2, and 2/3 are shown as circles in the left-hand panel and as vertical lines in the right-hand panels. The rectangle corresponding to the FOV limited to | Y| < 0.85 R⊙, which is used to compute the histograms vs. μ, is also shown.
Current usage metrics show cumulative count of Article Views (full-text article views including HTML views, PDF and ePub downloads, according to the available data) and Abstracts Views on Vision4Press platform.
Data correspond to usage on the plateform after 2015. The current usage metrics is available 48-96 hours after online publication and is updated daily on week days.
Initial download of the metrics may take a while.