Fig. 3
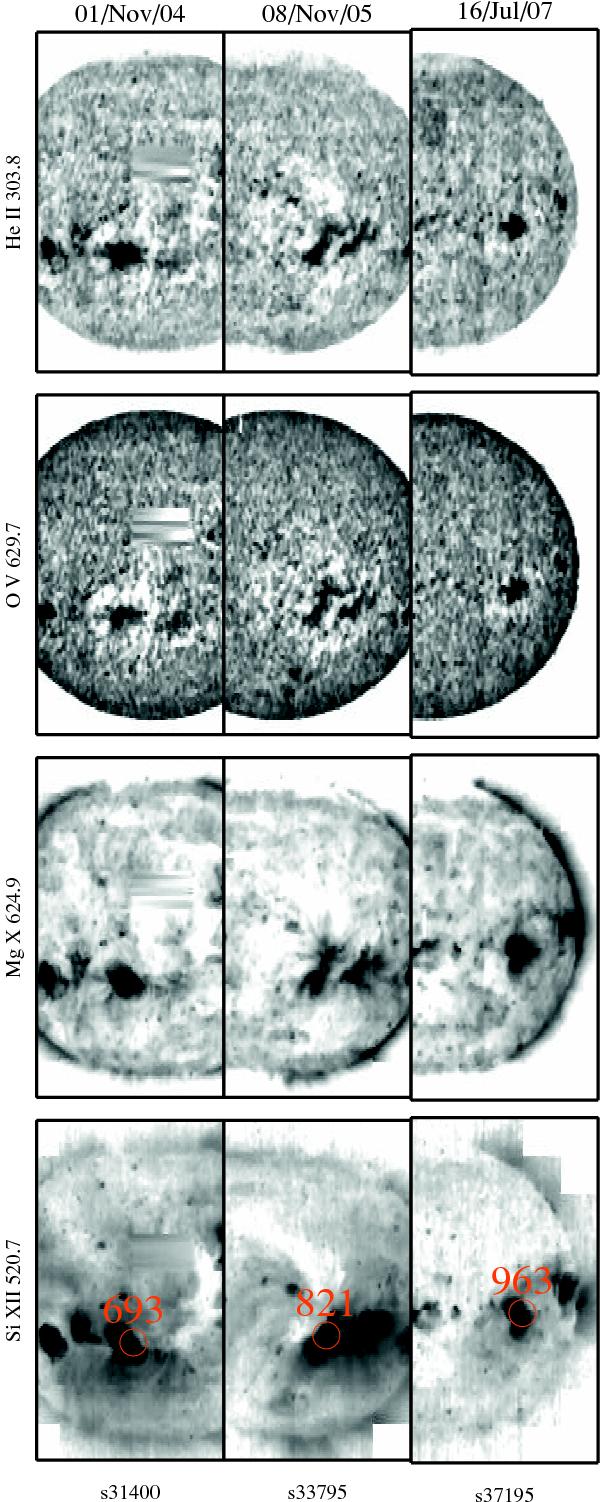
Radiance maps for the lines He ii 304 Å, O v 630 Å, Mg x 625 Å, and Si xii 521 Å (from top to bottom), from the CDS USUN mosaics taken on 1 November 2004, 8 November 2005, and 16 July 2007 (left to right). The active regions NOAA 693, 821, and 963, respectively, are also indicated. The logarithmic colour display table is inverted: higher-radiance areas are darker; for each line, the range of radiances is the same for all three dates. The horizontal stripes near the centre of the solar disk in the 2004 mosaics are due to a missing raster, which are filled-in here with interpolated values for display purposes.
Current usage metrics show cumulative count of Article Views (full-text article views including HTML views, PDF and ePub downloads, according to the available data) and Abstracts Views on Vision4Press platform.
Data correspond to usage on the plateform after 2015. The current usage metrics is available 48-96 hours after online publication and is updated daily on week days.
Initial download of the metrics may take a while.