Fig. 2
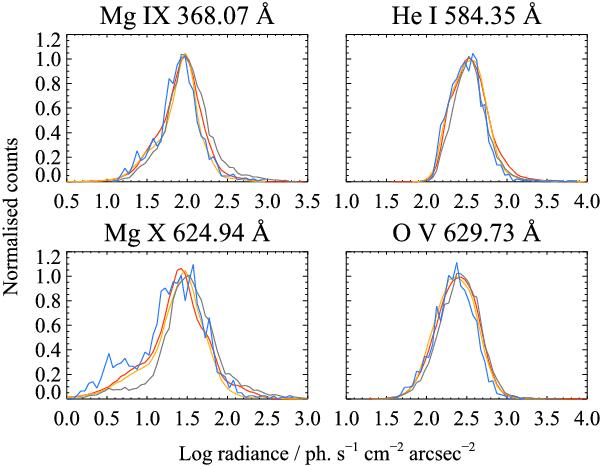
Comparison of line radiance histograms of four representative lines (Mg ix 368 Å, He i 584 Å, Mg x 625 Å, and O v 630 Å) from spectra in the USUN and SYNOP mosaics, as shown in Fig. 1: USUN on-disk data (grey), USUN on-disk data within the SYNOP FOV (blue), and data from the two SYNOP mosaics (red: mosaic starting on 22 June; orange: mosaic started on 23 June).
Current usage metrics show cumulative count of Article Views (full-text article views including HTML views, PDF and ePub downloads, according to the available data) and Abstracts Views on Vision4Press platform.
Data correspond to usage on the plateform after 2015. The current usage metrics is available 48-96 hours after online publication and is updated daily on week days.
Initial download of the metrics may take a while.