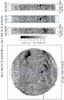
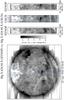
Fig. 1

Comparison of USUN and SYNOP data taken on 22 and 23 June 1998. The images show the integrated line radiances for the He i 584 Å and Mg x 625 Å lines in inverted, logarithmic scale (brighter areas correspond to fainter line radiances). The boundaries of the SYNOP FOV are also indicated.
Current usage metrics show cumulative count of Article Views (full-text article views including HTML views, PDF and ePub downloads, according to the available data) and Abstracts Views on Vision4Press platform.
Data correspond to usage on the plateform after 2015. The current usage metrics is available 48-96 hours after online publication and is updated daily on week days.
Initial download of the metrics may take a while.