Fig. 5
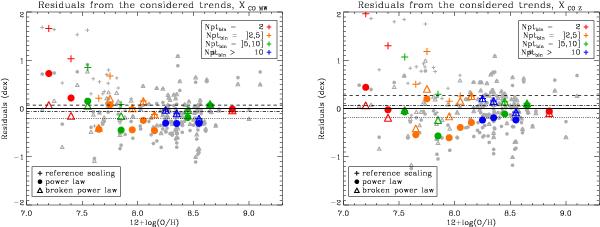
Residuals (i.e., logarithmic distance) between the observed (and detected) G/D and predicted G/D from the three relations for XCO,MW (left) and XCO,Z (right): reference scaling of the G/D with metallicity (crosses), the best power-law fit (filled circles) and the best broken power-law fit (triangles). These residuals are shown in grey for the individual galaxies and in colour for the average residuals in each metallicity bin defined in Sect. 3.1. The colours show the number of galaxies in each bin. The mean residual for all of the observed G/D values is shown by the dashed (reference scaling), dotted (power-law fit) and dash-dotted (broken power-law fit) lines for the three relations and are reported in Table 1.
Current usage metrics show cumulative count of Article Views (full-text article views including HTML views, PDF and ePub downloads, according to the available data) and Abstracts Views on Vision4Press platform.
Data correspond to usage on the plateform after 2015. The current usage metrics is available 48-96 hours after online publication and is updated daily on week days.
Initial download of the metrics may take a while.