Fig. 8
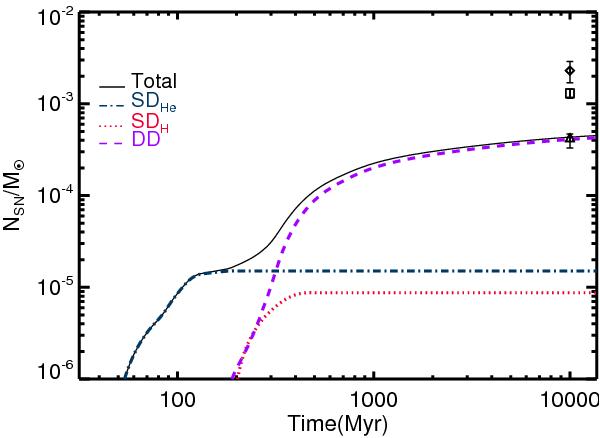
Number of SNe Ia (NSN) per unit mass versus time, with our standard model (Sect. 2). Line styles have the same meaning as in Fig. 7. Data points show the integrated rate (over a Hubble time) determined by Maoz et al. (2011, diamond), Maoz et al. (2012, square), and Graur & Maoz (2013, triangle).
Current usage metrics show cumulative count of Article Views (full-text article views including HTML views, PDF and ePub downloads, according to the available data) and Abstracts Views on Vision4Press platform.
Data correspond to usage on the plateform after 2015. The current usage metrics is available 48-96 hours after online publication and is updated daily on week days.
Initial download of the metrics may take a while.