Fig. 7
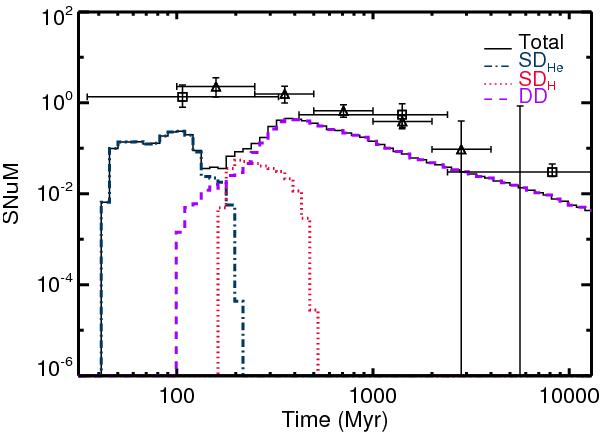
Delay-time distribution of the different channels with our standard model (Sect. 2): the SDHe channel (blue dash-dotted line), the SDH channel (red dotted line), the DD channel (purple dashed line), and the overall SN Ia rate (black thin full line), which is the sum of the three channels. The rate is presented in units of SNuM which is the SN Ia rate per 100 yr per 1010 M⊙ in stars. Data points represent the observed DTD from Totani et al. (2008, triangles) and Maoz et al. (2011, squares).
Current usage metrics show cumulative count of Article Views (full-text article views including HTML views, PDF and ePub downloads, according to the available data) and Abstracts Views on Vision4Press platform.
Data correspond to usage on the plateform after 2015. The current usage metrics is available 48-96 hours after online publication and is updated daily on week days.
Initial download of the metrics may take a while.