Fig. 5
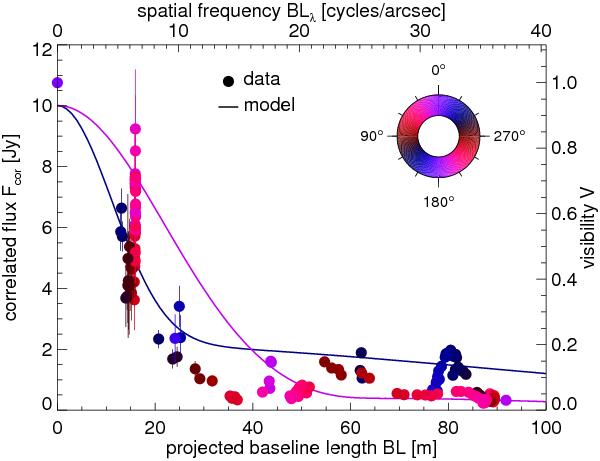
Correlated fluxes (Fcor, left ordinate) or
visibilities ( , right
ordinate) of the Circinus galaxy at 12 μm as a function of the projected
baseline length BL
(bottom axis) or spatial frequency (top axis). The data are colour-coded with the
position angle (see compass on the top right). Overplotted by two thick continuous
lines are the correlated fluxes of the three-component model discussed in Sect.
4. The correlated fluxes of the model are
along (violet) and (dark blue). Note that the errors in the measurements
with UT baselines (BL > 30 m) are smaller than the plot
symbol and that the model does not fully reproduce the total flux (plotted at
BL = 0 m) for
λ > 11.5 μm
(see Sect. 5.3).
, right
ordinate) of the Circinus galaxy at 12 μm as a function of the projected
baseline length BL
(bottom axis) or spatial frequency (top axis). The data are colour-coded with the
position angle (see compass on the top right). Overplotted by two thick continuous
lines are the correlated fluxes of the three-component model discussed in Sect.
4. The correlated fluxes of the model are
along (violet) and (dark blue). Note that the errors in the measurements
with UT baselines (BL > 30 m) are smaller than the plot
symbol and that the model does not fully reproduce the total flux (plotted at
BL = 0 m) for
λ > 11.5 μm
(see Sect. 5.3).
Current usage metrics show cumulative count of Article Views (full-text article views including HTML views, PDF and ePub downloads, according to the available data) and Abstracts Views on Vision4Press platform.
Data correspond to usage on the plateform after 2015. The current usage metrics is available 48-96 hours after online publication and is updated daily on week days.
Initial download of the metrics may take a while.