Fig. 4
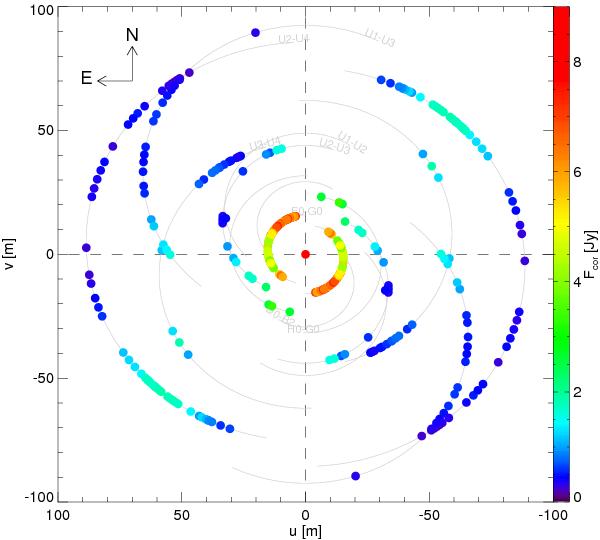
Correlated fluxes of the Circinus galaxy at 12 μm for all
uv
points containing useful interferometric data. The points are colour-coded
according to their correlated flux, Fcor(12 μm),
using a square root colour scaling as indicated in the colour bar on the right.
The uv point at the origin represents the
averaged total flux of the source, which is outside the plotted range of colours:
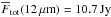 .
.
Current usage metrics show cumulative count of Article Views (full-text article views including HTML views, PDF and ePub downloads, according to the available data) and Abstracts Views on Vision4Press platform.
Data correspond to usage on the plateform after 2015. The current usage metrics is available 48-96 hours after online publication and is updated daily on week days.
Initial download of the metrics may take a while.