Fig. 2
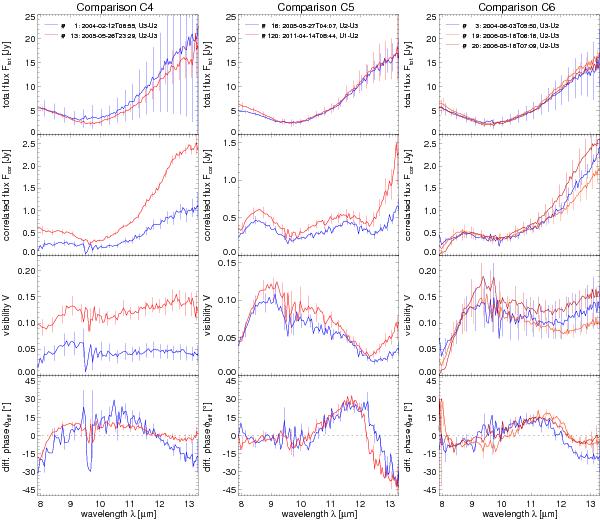
Comparison of the total and correlated flux spectra (first two rows), visibilities (third row) and differential phases (bottom row) at locations C4 (left column), C5 (central column) and C6 (right column). For clarity, error bars are only plotted every fifth wavelength bin. Note that for C4 and C6 the telescopes at the two epochs considered were interchanged (UT3-UT2 versus UT2-UT3). The phases of measurements #1 and #3 were corrected for this interchange in order to allow an easier comparison (see also discussion in Sect. 5.2).
Current usage metrics show cumulative count of Article Views (full-text article views including HTML views, PDF and ePub downloads, according to the available data) and Abstracts Views on Vision4Press platform.
Data correspond to usage on the plateform after 2015. The current usage metrics is available 48-96 hours after online publication and is updated daily on week days.
Initial download of the metrics may take a while.