Fig. 10
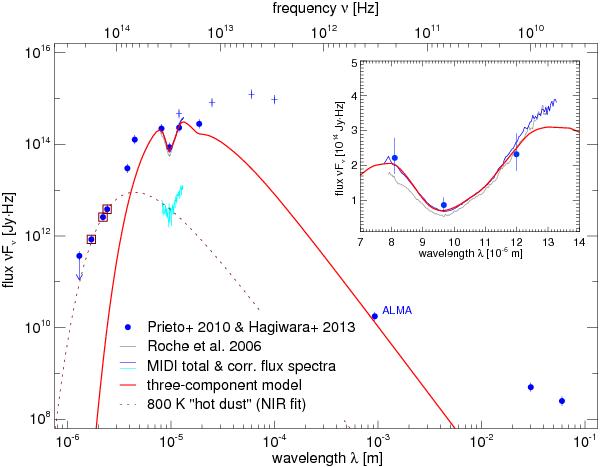
Nuclear SED of the Circinus galaxy. Blue dots are high resolution photometry compiled by Prieto et al. (2010) plus an additional measurement with ALMA at λ = 9.3 × 10⁻⁴ m (321 GHz) by Hagiwara et al. (2013). The measurement in the J-band, which is only an upper limit, is marked with an arrow. Also shown are low resolution IRAS photometry (blue crosses), a MIDI correlated flux spectrum (cyan line), the averaged MIDI total flux spectrum (blue line) and the high resolution spectrum from Roche et al. (2006, grey line). The SED of our best fitting model is plotted in red. A possible compact hot dust component, fitted to the SED data marked by the dark red boxes, is shown by the dotted, dark red line. A zoom on the N-band region with linear scaling of the axes is shown as an inset. See text for further details.
Current usage metrics show cumulative count of Article Views (full-text article views including HTML views, PDF and ePub downloads, according to the available data) and Abstracts Views on Vision4Press platform.
Data correspond to usage on the plateform after 2015. The current usage metrics is available 48-96 hours after online publication and is updated daily on week days.
Initial download of the metrics may take a while.