Fig. 1
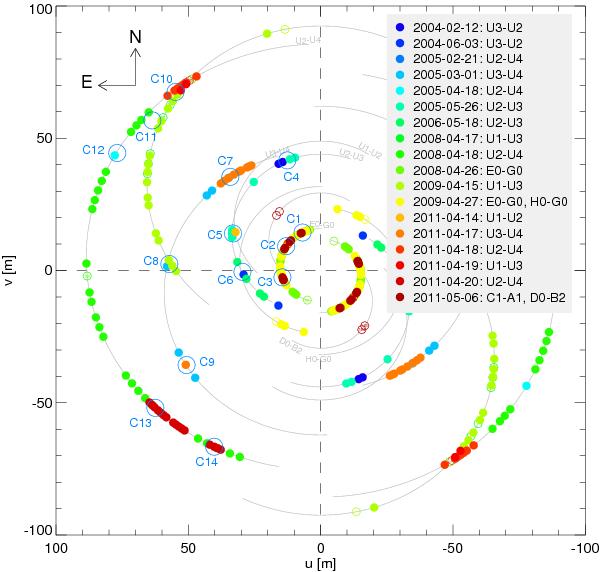
uv plane with all MIDI measurements of the Circinus galaxy. The individual uv points are colour-coded according to the different observing epochs. Successful measurements are shown by filled circles, failed measurements by open circles. The full baseline tracks are plotted in grey for all the telescope combinations used and for a minimum elevation of the Circinus galaxy of . In the baseline names, U stands for the UTs, A1 to G0 for the stations of the ATs. Regions used for the comparison of measurements at different epochs are encircled and labelled in blue (see Sect. 2.3). Every measurement appears twice, symmetric to the centre of the uv plane, because the Fourier transform of a real valued function (such as the intensity distribution on sky) is hermitian. As a consequence, the measurements which seem covered by the figure key are identical to those on the other side of the uv plane.
Current usage metrics show cumulative count of Article Views (full-text article views including HTML views, PDF and ePub downloads, according to the available data) and Abstracts Views on Vision4Press platform.
Data correspond to usage on the plateform after 2015. The current usage metrics is available 48-96 hours after online publication and is updated daily on week days.
Initial download of the metrics may take a while.