Fig. 8
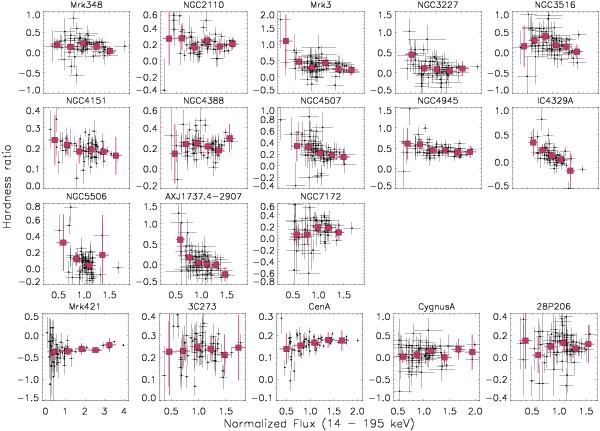
Hardness ratio versus 14–195 keV flux for the 18 AGN showing spectral variability (13 Seyfert galaxies on the three top rows and 5 radio loud AGN on the bottom row). The black dots are from the 1-month binned light curves, and red squares indicate the average hardness ratio in different flux bins.
Current usage metrics show cumulative count of Article Views (full-text article views including HTML views, PDF and ePub downloads, according to the available data) and Abstracts Views on Vision4Press platform.
Data correspond to usage on the plateform after 2015. The current usage metrics is available 48-96 hours after online publication and is updated daily on week days.
Initial download of the metrics may take a while.