Fig. 5
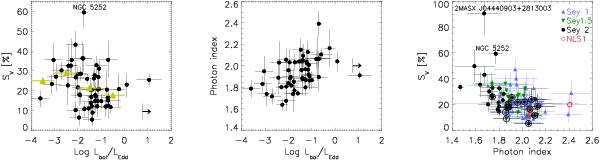
Left: variability estimator SV versus Eddington ratio for the Seyfert sample. Yellow triangles represent the average of the variability estimator in different Eddington ratio bins. Middle: photon index versus Eddington ratio for the Seyfert sample. Right: variability estimator SV versus photon index for all the Seyfert galaxies in our sample, separated into the different types. Empty black circles indicate those sources with 1023 < NH < 4 × 1023 cm-2.
Current usage metrics show cumulative count of Article Views (full-text article views including HTML views, PDF and ePub downloads, according to the available data) and Abstracts Views on Vision4Press platform.
Data correspond to usage on the plateform after 2015. The current usage metrics is available 48-96 hours after online publication and is updated daily on week days.
Initial download of the metrics may take a while.