Fig. 2
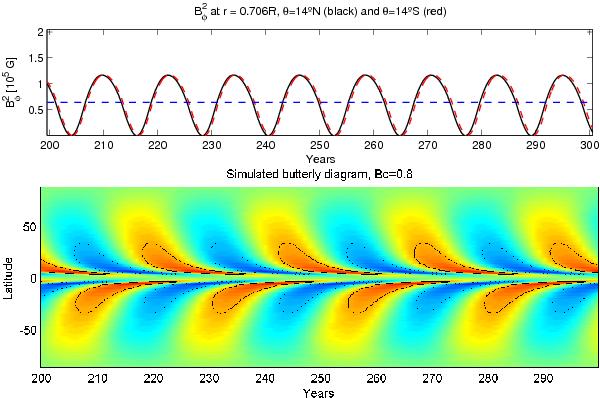
Top panel: toroidal field amplitude,  at r = 0.706 R⊙ and at θ = 14° north (solid, black) and south (dashed, red). The dashed line represents the buoyancy threshold (
 ). The corresponding analog to a butterfly diagram is presented below for the field at the same depth. Blue represents negative fields, red positive fields, and green an average of zero. The contours enclose the areas where eruptions occur (Bφ > Bc).
Current usage metrics show cumulative count of Article Views (full-text article views including HTML views, PDF and ePub downloads, according to the available data) and Abstracts Views on Vision4Press platform.
Data correspond to usage on the plateform after 2015. The current usage metrics is available 48-96 hours after online publication and is updated daily on week days.
Initial download of the metrics may take a while.