| Issue |
A&A
Volume 563, March 2014
|
|
|---|---|---|
| Article Number | A118 | |
| Number of page(s) | 11 | |
| Section | Extragalactic astronomy | |
| DOI | https://doi.org/10.1051/0004-6361/201322615 | |
| Published online | 19 March 2014 | |
Searching for star-forming dwarf galaxies in the Antlia cluster ⋆
1 Isaac Newton Group of Telescopes, Apto. 321, 38700 Santa Cruz de la Palma, Canary Islands, Spain
e-mail: This email address is being protected from spambots. You need JavaScript enabled to view it.
2 Instituto de Astrofísica de Andalucía (CSIC), Apto. 3004, 18080 Granada, Spain
3 Grupo de Investigación CGGE, Facultad de Ciencias Astronómicas y Geofísicas, Universidad Nacional de La Plata, Paseo del Bosque, B1900FWA La Plata, Argentina
4 Consejo Nacional de Investigaciones Científicas y Técnicas (CONICET), C1033 AAJ Ciudad Autónoma de Buenos Aires, Argentina
5 Instituto de Astrofísica de La Plata (CCT-La Plata, CONICET-UNLP), Paseo del Bosque, B1900FWA La Plata, Argentina
Received: 5 September 2013
Accepted: 31 January 2014
Abstract
Context. The formation and evolution of dwarf galaxies in clusters need to be understood, and this requires large aperture telescopes.
Aims. In this sense, we selected the Antlia cluster to continue our previous work in the Virgo, Fornax, and Hydra clusters and in the Local Volume (LV). Because of the scarce available literature data, we selected a small sample of five blue compact dwarf (BCD) candidates in Antlia for observation.
Methods. Using the Gemini South and GMOS camera, we acquired the Hα imaging needed to detect star-forming regions in this sample. With the long-slit spectroscopic data of the brightest seven knots detected in three BCD candidates, we derived their basic chemical properties. Using archival VISTA VHS survey images, we derived KS magnitudes and surface brightness profile fits for the whole sample to assess basic physical properties.
Results. FS90-98, FS90-106, and FS90-147 are confirmed as BCDs and cluster members, based on their morphology, KS surface photometry, oxygen abundance, and velocity redshift. FS90-155 and FS90-319 did not show any Hα emission, and they could not be confirmed as dwarf cluster star-forming galaxies. Based on our data, we studied some fundamental relations to compare star forming dwarfs (BCDs and dIs) in the LV and in the Virgo, Fornax, Hydra, and Antlia clusters.
Conclusions. Star-forming dwarfs in nearby clusters appear to follow same fundamental relations in the near infrared with similar objects in the LV, specifically the size-luminosity and the metallicity-luminosity, while other more fundamental relations could not be checked in Antlia due to lack of data.
Key words: galaxies: dwarf / galaxies: fundamental parameters / galaxies: evolution / galaxies: photometry / galaxies: starburst / galaxies: star formation
Based on observations acquired at Gemini South (GS-2010A-Q-51 and GS-2012A-Q-59) and ESO VISTA Hemisphere Survey (VHS).
© ESO, 2014
1. Introduction
Blue compact dwarf galaxies (BCD) are part of the vast family of dwarf that also includes dwarf elliptical (dE), dwarf irregular (dI), and dwarf spheroidal (dSph) galaxies. BCDs show quite distinctive characteristics, such as intense star formation at their central regions and low metallicity (e.g., Kehrig et al. 2008; Cairos et al. 2009), but most of them also harbor an old stellar population that accounts for most of their mass (Papaderos et al. 1996; Cairós et al. 2001; 2002; Noeske et al. 2003; 2005; Vaduvescu et al. 2006; Amorín et al. 2009). Some BCDs carry important information related to the first stages of star formation (Sargent & Searle 1970; Lequeux & Viallefond 1980; Kunth & Sargent 1986) and the study of nearby BCDs located in the local universe should be used first to elucidate properties of high-redshift, low-mass galaxies that are harder to reach.
According to the observational criteria proposed by Thuan & Martin (1981) and Gil de Paz, Madore & Pevunova (2003), BCDs have low luminosity (MB ≳ − 18 mag and MK ≳ − 21 mag) and low peak surface brightness (μB < 22 mag arcsec-2), and their integrated colours are mainly blue (mean B − R ≈ 0.7 mag). Spectroscopically, they show intense and narrow emission lines super-imposed on a faint and blue optical continuum (Kehrig et al. 2004). The oxygen abundance takes values, for instance, in the range 7.49 ≤ 12 + log (O/H) ≤ 8.81 dex in a sample of about 70 nearby field BCDs selected from the Gil de Paz et al. (2003) sample by Zhao, Gao & Gu (2010), though abundances were obtained using different methods (see also Cairos et al. 2010; Kehrig et al. 2013). These results support the statement that they are metal-poor systems, since their oxygen abundances are mostly below the solar value (12 + log (O/H) ≈ 8.7 dex (Asplund et al. 2009).
A correlation between the oxygen abundance and the absolute KS magnitude seems to hold for BCDs and dIs both in the Local Volume (LV), defined as the nearby Universe within d < 11 Mpc (Karachentsev et al. 2013), and in the nearby clusters (Vaduvescu et al. 2007; 2011). Furthermore, the near infrared (NIR) luminosity of the old stellar population in star-forming dwarfs can be used to estimate the gas fraction (Vaduvescu et al. 2005; 2006), defined as the gas mass over total baryonic mass (i.e., gas and stars). Vaduvescu et al. (2011) confirmed that the abundance – gas fraction relation for LV BCDs seems to be followed by star-forming dwarfs located in Virgo, Fornax, and Hydra clusters. Based on these results, they propose that the chemical evolution of BCDs in the Virgo and Hydra clusters seems to be consistent with the predictions of a closed-box model. They also suggest that the mass-metallicity relation followed by star-forming dwarfs looks different for environments of different densities. The dwarfs in clusters follow a mass-metallicity relation with a slope steeper than the one of the same relation for LV dwarfs. More recently, Zhao et al. (2013) have examined the oxygen abundance-gas fraction relation obtained for a sample of 53 BCDs and 22 field dIs and compared it with different models of chemical evolution. They conclude that most galaxies in their sample do not agree with a closed-box model; i.e., BCDs do not seem to have evolved as isolated systems. Since the dispersion in most of these relations is rather large, it is essential to increase the sample in order to determine the influence of the environment.
During the past decades, a few possible evolutionary connections between different types of dwarfs (BCDs, dIs, dEs, dSphs) have been explored, taking into account that several physically different channels are at work, but the whole evolution scenario between them remains far from clearly understood (e.g., Kunth & Östlin 2000; Vaduvescu et al. 2011 and references therein; Sánchez-Janssen et al. 2013). This paper follows Vaduvescu et al. (2006; 2007) who focussed on Virgo cluster, and Vaduvescu et al. (2011), who focussed on the Fornax and Hydra clusters, all with the aim of studying star-forming dwarfs (BCDs and dIs) in nearby clusters and comparing their evolution with a field sample (Vaduvescu et al. 2005; McCall et al. 2012). Following this investigation, in this sense we now scrutinize one small sample of star-forming dwarf candidate galaxies located in the southern cluster Antlia. The paper is organized as follows: Sect. 2 describes the cluster and object selection, and Sect. 3 presents the observations and data reduction. The results are presented in Sect. 4 and discussed in Sect. 5. Finally, Sect. 6 summarizes the main conclusions derived from this work.
2. Cluster and target selection
To address possible environmental effects of dwarf formation and evolution, star-forming dwarfs located in nearby clusters should be studied first, and the most accessible clusters remain the closest ones (d < 100 Mpc).
The Antlia cluster (or Abell S636) is the third nearest well populated cluster (d = 35.16 ± 1.78 Mpc – Dirsch et al. 2003) to our Local Group, with only the Virgo cluster (minimum distance d ≥ 16.5 Mpc; Gavazzi et al. 2003; 2005) and Fornax (d = 20.0 ± 1.7 Mpc, Blakeslee et al. 2009), and closer than Hydra (d = 46 ± 5 Mpc, Jensen et al. 1999). Antlia is a moderately compact group classified as a rare Bautz-Morgan type III cluster, meaning that the cluster has no dominating brightest galaxy. Located in the Hydra-Centaurus supercluster, Antlia shows an elongated morphology with two major concentrations dominated by the massive and equally bright elliptical galaxies NGC 3268 and NGC 3258.
Using spectral data, Hopp and Materne (1985) measured radial velocities of 258 galaxies in the direction of Antlia cluster within a large region spanning 10 square degrees. This region sample was based on the Lauberts (1982) photographic catalogue built using plates taken with the ESO 1-m Schmidt telescope in La Silla. This catalogue consists mostly of spiral (~75%) and elliptical galaxies (~15%), with about 10% classified as irregular and including ~5% dwarfs. The Antlia cluster itself was defined dynamically by Hopp and Materne (1985) by fitting a probability density function to the observed Lauberts galaxy distribution. Besides the main group (named Antlia I), these authors identified four small galaxy systems (“mini-clusters”) from which the Antlia II system alone could compare in total luminosity and mass with Antlia I. The mean radial velocity of early type and late type galaxies of the Antlia I system are similar, which is different from the Virgo cluster. For all five mini-clusters the authors derived mean velocities, dispersions, total luminosities, virial masses, virial radii, and mass-to-light ratios (see Table V of Hopp and Materne, 1985).
The first photographic survey of Antlia was published by Ferguson & Sandage (1990, abbreviated FS90 catalogue) who identified 375 galaxies by visual inspection in a search considered complete to BT ~ 20 mag using plates taken with the 2.5m du Pont telescope in Las Campanas Observatory. A membership status and a morphological type was assigned to each galaxy of the FS90 catalogue (1: definite member, 2: likely member, 3: possible member). From the total of 375 galaxies, 232 are classified as definite or likely members. Forty-nine galaxies are classified as irregular (13%) and only seven are classified as BCDs (2%). The density profile of the cluster (counted in total number of galaxies per square degree) drops off steeply with radius, this trend being similar with those of Fornax, Virgo, and other clusters (Ferguson and Sandage, 1990 – see their Figs. 15 and 16).
Nakazawa et al. (2000) studied the ASCA and ROSAT satellite observations of Antlia, concluding that the cluster is bright in the X-ray and almost isothermal within 50′ diameter around NGC 3268 (i.e., one of the two peak emissions visible on both ASCA and ROSAT X-ray images), deriving an average cluster temperature of kT ~ 2.0 keV. The modelled metal abundance is Z ~ 0.35 Z⊙, and the cluster luminosity is  erg s-1 within
  kpc (Nakazawa et al. 2000). There is no X-ray central excess brightness and little central cool component, from which one could conclude that the potential profile of Antlia is simple, because it lacks the hierarchical structure often seen in other nearby poor clusters dominated by one single central galaxy.
During the past decade, the study of Antlia has been continued with CCD photometric and spectroscopic studies of the galaxies’ stellar content, part of the Argentinian-Chilean Antlia Cluster Project based mainly on data obtained with the 4 m Blanco telescope at CTIO, the VLT, and Gemini 8 m telescopes, as well as imaging data taken from the HST archive. This Antlia Cluster Project covers not only star-forming galaxies, but also globular clusters (Dirsch et al. 2003; Bassino et al. 2008), ultra-compact dwarfs (UCDs: Caso et al. 2013; Caso et al., in prep.) and galaxy populations (Smith Castelli et al. 2008a,b, 2012; Calderón et al., in prep.; Bassino et al., in prep.).
Based on the literature mentioned above (specifically the FS90 catalogue), for the present work we selected the best five BCD Antlia cluster candidates, namely FS90-98, FS90-106, FS90-147, FS90-155, and FS90-319. All of them were classified as “BCD” or “BCD?” in the FS90 catalogue and were selected because they show star-forming knots on the MOSAIC Antlia Project images obtained with MOSAIC 4-m Blanco telescope (CTIO). Though FS90-98 and FS90-106 were originally classified by FS90 as “status 3” (i.e., possible cluster member), they were later spectroscopically confirmed to be members of Antlia (Smith Castelli et al. 2008a). The rest of the objects, FS90-147, FS90-155, and FS90-319, are candidates with membership “status 2” (i.e., likely member). The two confirmed BCDs share the same locus at the colour-magnitude diagram of FS90 galaxies in the cluster core, on the blue side of the colour-magnitude relation defined by the early-type Antlia galaxies (Smith Castelli et al. 2008a, see their Fig. 2), where the “blue cloud” of star-forming galaxies is expected (e.g., Bell et al. 2007).
In this paper we adopt a distance modulus for the Antlia cluster (m − M) = 32.73 ± 0.25 (Dirsch et al. 2003) determined based on the surface brightness fluctuation (SBF) and fundamental plane methods for the two large elliptical members NGC 3258 and NGC 3268, which corresponds to the cluster distance d = 35.16 Mpc, so that 1 arcsec subtends 170 pc.
Observing log of the star-forming dwarf galaxies in the Antlia cluster observed with Gemini South and VISTA.
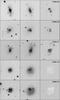 |
Fig. 1 Continuum R G0326 (left panel, FOV 1′ × 1′), Hα G0336 (middle panel, FOV 0.5′ × 0.5′), and Hα images (right panel, FOV 0.5′ × 0.5′) of the Antlia dwarf star-forming candidates observed with GMOS at Gemini South. The 1′′ GMOS slit and the two slits A and B used for FS90-147 are drawn in white in the right column plots, including most of the net Hα emission knots. |
3. Observations
Two proposals were submitted by our team in 2009 and 2011 and observed by the Gemini South 8.1m telescope in service mode in 2010A (Run ID: GS-2010A-Q-51) and 2012A (Run ID: GS-2012A-Q-59) in both imaging and spectroscopy modes. Additionally, VISTA Hemisphere Survey (VHS) KS band images from the ESO Image Archive1 were used.
3.1. Gemini Hα and R imaging
During the first Gemini run, we used the Gemini Multi-Object Spectrograph camera (GMOS-S; Hook et al. 2004) to acquire Hα imaging of the sample. The GMOS-S camera consists of three 2048 × 4608 pixel CCDs with pixel size 13.5 μm, resulting in a 6144 × 4608 pixel mosaic covering 5.5′ × 5.5′ on-sky field. We used 2 × 2 binning (pixel scale of  ) that yielded a total field of view of
  . All observations were taken in poor weather Band 3 conditions defined as image quality 85% (Zenith seeing R ≤ 1.05′′), clouds cover 70% (patchy clouds or extended thin cirrus), sky background 80% (grey) and any water vapour.
For all targets, we used the Ha_G0336 and r_G0326 Gemini filters (briefly, Hα and R, respectively). The observed seeing in R was between 0.8′′ − 1.0′′. The observing log of our Gemini run is given in Table 1.
We processed the Hα and R pre-imaging frames in IRAF2 (only the central CCD including our small targets) using reduced bias and flat field images, then we combined the individual frames to produce the final reduced images. The “net” Hα images were continuum-subtracted by measuring about 20 stars in each field, whose magnitudes were scaled in order to subtract R images from the original Hα images. For the R images we derived zero points using 10–15 stars in each field with available R magnitudes from the UCAC4 catalogue that were expected to have magnitude errors smaller than 0.1 mag (Zacharias et al. 2012). Our determined zero points agree with published Gemini night zero points within 0.1 mag, thus UCAC4 magnitudes are trust worthy for achieving this photometric precision. We present the reduced Gemini R, Hα and pure Hα images in Fig. 1 (left, middle, and right panels, respectively).
3.2. VISTA KS imaging
The KS imaging covering Antlia cluster was observed on 5 Feb. 2013 by the VHS. VISTA 4.1m telescope uses the VIRCAM camera, which consists of 16 inter-spaced Raytheon VIRGO HgCdTe infrared detectors 2048 × 2048 pixels having a pixel scale of 0.34″ and covering each 11.6′ × 11.6′ field of view. The seeing was 1.0″.
We queried the ESO Image Archive, downloaded and reduced VISTA raw KS images covering each galaxy, resulting in four images for each target exposed for 15 s, thus 1min total exposure time for each galaxy. The VISTA VSH survey remains quite shallow for dwarf galaxies, nevertheless sufficient to detect in KS our five targets and derive their magnitudes and KS surface brightness profiles.
NIR image reduction was performed in IRAF. The sky was subtracted using the raw image closest in time to any raw science image, in order to remove the rapid sky and instrument signature variations. To reduce the KS photometry, we calculated zero points based on 10–15 available 2MASS stars in each of the VISTA CCD fields, resulting in zero point errors less than 0.1 mag for each reduced field. We present the reduced VISTA KS images in Fig. 2.
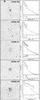 |
Fig. 2 VISTA VHS KS images (left panel, FOV 1′ × 1′, normal orientation) and surface brightness profiles in KS and R of the five Antlia BCD candidates. For the KS fits, we plot the sech component (continuous thick line), the Gaussian component (dashed line), and the sum of the two (continuous thin line). The colour profiles R − KS are plotted at the bottom of each graph. |
3.3. Gemini spectroscopy
During the second Gemini run, follow-up spectroscopic data were obtained for the best three BCD candidates, using the same GMOS-S camera. The observed galaxies are listed in Table 1. We used the B600 grating centred at 4610 Å in the blue and the R400 grating centred at 6120 Å to cover the red side of the spectrum. The data were binned by a factor of 2 in the spatial and the spectral dimensions, yielding a scale of 0.146′′/pixel. The spectral resolution is 5.0 Å FWHM and 7.0 Å FWHM on the blue and the red sides, respectively. We took the spectra of the galaxies using a slit width of 1.0″. Observations of the spectrophotometric standard star LTT 3864 were obtained during the observed nights for flux calibration. Bias frames, dome flat-fields and CuAr arc exposures were taken as part of the Gemini baseline calibrations.
We reduced the GMOS long-slit spectra using the standard Gemini IRAF routines. More details on the GMOS data reduction procedure can be found in Vaduvescu et al. (2011). We extracted the 1D spectra from the wavelength-calibrated and cosmic-ray-subtracted 2D spectra. The flux calibration of the 1D spectra was performed using the observations of the flux standard star LTT 3864. The flux-calibrated spectra for our galaxies are displayed in Fig. 3.
4. Results
4.1. Imaging and surface photometry
4.1.1. Gemini R and Hα imaging
We present the Gemini R images in the left-hand panel of Fig. 1 (field of view FOV 1′ × 1′ and normal sky orientation). The middle panel includes the reduced Hα images (FOV 0.5′ × 0.5′), and the net Hα images are included in the right-hand panel (FOV 0.5′ × 0.5′).
Only three galaxies show clear net Hα emission, namely FS90-98, FS90-106, and FS90-147. Consequently, we selected them as best BCD candidates and have acquired Gemini spectroscopy for them for the remaining proposed time. Although the other two objects, FS90-155 and FS90-319, produced clear details in both R and Hα images (a few brighter knots and some fainter structure), both failed to show any clear net measurable Hα emission. This is a possible consequence of either the poor observing conditions (causing imperfect continuum removal), doubt about cluster membership (background/foreground galaxies), or the non-starburst nature of these galaxies.
We studied the surface photometry of the Gemini R images, employing the STSDAS package (ELLIPSE task) in IRAF fixing the three parameters (centre, ellipticity, and position angle) in an iterative approach. The surface brightness profiles in R are plotted in the right-hand panel of Fig. 2 together with error bars (visible only on the outskirts). Total apparent magnitudes in R were measured by integrating growing ellipses and are listed in Table 2.
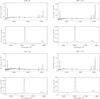 |
Fig. 3 Blue and red spectra (shown above and below), in units of 10-15 erg s-1 cm-2 Å-1, of the star-forming candidates in our Antlia cluster: FS90-98 (integrating knots 1 and 2), FS90-106 (knot 1), FS90-147A (integrated knots A1 and A2), and FS90-147B (integrated knots B1 and B2). |
Physical parameters of the galaxies observed in KS and R bands in Antlia cluster.
4.1.2. VISTA KS imaging
The reduced VISTA KS images are presented in the left-hand panel of Fig. 2 (FOV 1′ × 1′, matching the R field, and normal sky orientation). All five objects were detected by VISTA in 1 min, with FS90-106 and FS90-147 being the faintest objects.
Because of the much shallower VISTA KS images compared with Gemini R ones, we matched the NIR ellipse fitting parameters (center, ellipticity, and position angle) with the deeper ones in R, in order to perform the shallower KS surface photometry using more solid initial conditions. NIR bands and particularly KS are better than visible bands in tracing galaxy stellar mass, because the old star population tracing most of the mass is mostly visible in the NIR, while young stars dominate the flux in the visible (e.g., Vaduvescu et al. 2005).
Despite the short integration time of VISTA imaging, in Sect. 5 we employ the NIR fits to study surface photometry in order to characterize galaxy profiles and classify them. Following our previous BCD work, we modelled all NIR profiles with two components, namely a “sech” function (hyperbolic secant) to account for the old extended component discovered to fit dIs well (Vaduvescu et al. 2005) plus a Gaussian to account for the outburst close to center in a BCD (Vaduvescu, Richer & McCall 2006). To derive the two components, we used the NFIT1D function of the FITTING package under IRAF.
Given its importance for our study, we call the definition of the “sech” fit (Vaduvescu et al. 2005): 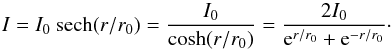 (1)Here I represents the fitted flux at radius r (defined as the distance from the centre along the semi-major axis), I0 is the central intensity (expressed in counts/pixel), and r0 represents the scale length of the profile (expressed in pixels). One should note that both these two “sech” fitting parameters have the same meaning as the central intensity and scale radius fit by the classical exponential, de Vaucouleur, or Sérsic models. In magnitude units, the sech fit is given by the following equation:
  (2)where zps represents the zero point of the surface brightness magnitude system. At larger radii, Eq. (2) is convergent to the sech magnitude (mS), while curving and levelling out at near-zero radii toward the central surface brightness (μ0). Expressed in mag arcsec-2, the central surface brightness is simply
  (3)In the right-hand panel of Fig. 2 we plot the KS sech fit, the Gaussian, and the total of the two components which closely follows the profiles of BCDs from the outskirts to the centre. Error bars in KS are larger than those in R, and surface brightness profiles sample about three times less than their R deeper Gemini counterparts.
Our estimated errors are less than 0.3′′ in position centre, about 0.1 in ellipticity, and less than ten degrees in position angle. Within these errors, based on an independent analysis of the R profiles using variable fitting parameters made by one of us (JPC), the ellipse fitting parameters in KS and R bands agree very well, despite the much shallower KS profiles.
4.1.3. Physical parameters
In Table 2 we include the physical parameters derived in KS and R. Ellipticity e and position angle PA (measured from the north positively counter-clockwise) are given in the Cols. 2 and 3. Total apparent magnitudes mTK in KS (Col. 4) and mTR in R (Col. 9) were measured by integrating growing ellipse apertures, and R − KS total colours (Col. 10) were derived from them. Sech magnitudes mSK (Col. 5) were derived by modeling the KS profiles with the sech + Gaussian, where μ0K (Col. 6) represents the sech central surface brightness expressed in mag/arcsec2 and r0K (Col. 7) is the sech scale radius expressed in arcsec. The calculated sech semi-major radius r22K (Col. 8, in arcsec) at mK = 22 mag/arcsec2 are listed next. The sech absolute magnitudes in KS, MSK (Col. 11) were calculated from sech mSK using the adopted distance modulus for the cluster (m − M) = 32.73 mag. The hypothetical absolute magnitudes of the last two galaxies were calculated under the assumption of cluster membership (neither confirmed based on the available data nor on our undetected Hα flux). We plotted the colour profiles (up to the shallower KS limit) in the right-hand panel of Fig. 2.
Reddening-corrected line fluxes relative to F(Hβ) = 1 for the sample of Antlia galaxies.
4.1.4. Comparison with the literature
Few data are available in the literature to compare with our derived total magnitudes. Using Blanco MOSAIC imaging in Kron-Cousins R band and 1′′ seeing, Smith Castelli et al. (2008a) derived for FS90-98 R = 15.92 mag, which comes very close to our result (R = 16.02 mag), while for FS90-106 same authors derived R = 17.08 mag, again very similar to our measurements (R = 17.02 mag). Two objects were detected by 2MASS, namely FS90-155 whose 2MASS KS = 13.26 magnitude coincides with our VISTA measurement, and the extremely faint galaxy FS90-319 whose shallower 2MASS measurement (KS = 13.76 mag) comes quite close to our VISTA measurements (R = 13.16 mag).
4.2. Spectroscopic analysis
4.2.1. Cluster membership
Averaging our measurements obtained from the two bright lines, 5007 [OIII] and 6563 Hα, we obtain the following redshift and velocities for the three galaxies observed in spectroscopy mode: for FS90-98 z = 0.0095, v = 2850 km s-1, for FS90-106 z = 0.0086, v = 2580 km s-1, and for FS90-147 z = 0.0062, v = 1860 km s-1. Compared to the cluster average velocity and 3σ dispersions of the sub-clusters detected by Hopp & Materne (1985 – see their Table 5), we can confirm cluster membership for all three galaxies.
4.2.2. Line fluxes
For each spectrum we measured fluxes and equivalent widths (EW) of the emission lines using the Gaussian profile-fitting option in the IRAF task SPLOT. The intensity of each emission line was derived by integrating between two points given by the position of a local continuum. The line-flux errors were calculated using the following expression (e.g., Castellanos 2000; Kehrig et al. 2008):  (4)where σcont is the standard deviation of the continuum near the emission line, N is the width of the region used to measure the line in pixels, Δλ is the spectral dispersion in Å/pixel, and EW represents the equivalent width of the line.
We computed the reddening coefficient, C(Hβ), from the ratio of the measured-to-theoretical Hα/Hβ, while simultaneously solving for the effects of underlying Balmer absorption and assuming case B recombination for Te = 104 K and ne = 100 cm-3 (Storey & Hummer 1995). Formal errors in the C(Hβ) were computed by propagating uncertainties in line fluxes, I(Hα) and I(Hβ): }\right]\cdot \end{equation}](/articles/aa/full_html/2014/03/aa22615-13/aa22615-13-eq122.png) (5)Table 3 lists the de reddened emission line fluxes relative to Hβ for the observed objects along with their extinction coefficient C(Hβ).
(5)Table 3 lists the de reddened emission line fluxes relative to Hβ for the observed objects along with their extinction coefficient C(Hβ).
4.2.3. Nebular analysis
We obtained the electron densities, ne, from the [SII]λλ6717/6731 line ratio following the five-level atom FIVEL software (Shaw & Dufour, 1994) available in the IRAF task TEMDEN. The derived ne values place all galaxies in the low-density regime (ne ≤ 100 cm-3).
To obtain direct oxygen abundance measurements, one should first derive the electron temperature, which requires the measurement of faint auroral lines. We could not detect any temperature-sensitive line in our spectra (such as [OIII]λ4363). In this case, the alternative is to use strong line-abundance indicators (e.g., Pagel 1979; Kehrig et al. 2006; Pilyugin et al. 2010; Marino et al. 2013). To estimate the oxygen abundance we applied the widely used N2 parameter [N2 ≡ log ([NII]λ6584/Hα)] following the empirical calibration proposed by Marino et al. (2013). This parameter does not depend on reddening effects or flux calibration issues owing the close wavelength of the two lines involved. In addition, the relationship between N2 and O/H is single-valued. Recently, Marino et al. (2013) have revised the N2 index using a new dataset comprising 603 extragalactic HII regions that represents the most comprehensive compilation of Te-based abundances in external galaxies to date. The uncertainty in the metallicity determination based on this calibration amounts to ~0.2 dex. Oxygen abundances for our sample galaxies are given in Table 3.
5. Discussion
In this section we discuss our findings obtained from the Gemini and VISTA imaging data (Figs. 1 and 2) and spectroscopy data (Table 3). We compare our results with other (very scarce) literature findings.
5.1. Morphological analysis
FS90-98 resembles to an iE galaxy, defined by Loose & Thuan (1986) as a compact galaxy showing several knots closed to centre superposed on a larger low surface brightness non-star-forming elliptical component. It shows two non-central star-forming knots (noted 1 and 2) separated by 4.4′′ in the net Hα right-hand panel image of Fig. 1. The colour profile appears slightly bluer towards the outskirts, with total colour of R − KS = 2.02 mag. The KS profile could be fitted with a sech plus a Gaussian component, consistent with the BCD classification of this galaxy.
FS90-106 shows a similar iE appearance in both R and Hα images with at least two non-central knots visible in the Hα image separated by 2.5′′. The total color R − KS = 1.12 is very blue, consistent with a BCD classification. Nevertheless, the KS image is the faintest in the whole sample, so the KS apparent magnitude and colour profile should be regarded with caution outside ~ 3′′ radius.
FS90-147 clearly shows a few non-central knots in the Gemini R and Hα images, labelled along the two slits A and B in Fig. 1. The most visible are the four central bright knots in the Hα image. The brighter pair (along slit A) is separated by 2.9″, while the fainter pair along slit B is separated by 4.2″ (nodes marked as B1 and B2). Other diffuse regions are visible to the north and south in the Hα image, from which node B3 was also placed along slit B. The KS image is quite shallow and shows extended diffuse NIR emission, while the R − KS profile seems to become redder towards the outskirts sampled areas, and total colour is R − KS = 2.25 mag. All these findings, together with the surface profile in KS make the BCD classification probable for this galaxy.
FS90-155 clearly shows a nucleus close to centre in the R, Hα and KS images, having no Hα emission. Its margins appear well defined towards the north-east, while towards the south this galaxy shows some flocculences (more visible visible in the original FITS image), which resembles more of a spiral galaxy with counter-clockwise winding arms. The colour profile varies between 1.5 < R − KS < 3.0 with total colour R − KS = 2.43 mag.
FS90-319 shows two brighter knots superposed in the North of an elliptical diffuse emission in all R, Hα and KS images, although no Hα emission could be detected. Due to the brighter knot in the North-East, both R and KS profiles show a peak around 6′′ radius, and the colour profile appears flat at R − KS ~ 2.4 mag.
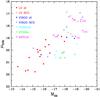 |
Fig. 4 Sech central surface brightness μ0SK (mag arcsec-2) versus sech absolute magnitude MSK for the star-forming dwarfs in the Local Volume, Virgo, Fornax, Hydra, and Antlia samples. The well known linear trend is probed by the Antlia galaxies. |
5.2. Chemical abundance analysis
This section discusses the oxygen abundances derived using the strong-line method by Marino et al. (2013). Both emission knots of FS90-098 in the Hα image (labelled 1 and 2 in the upper right panel of the Fig. 1) were spectroscopically resolved. In Table 3 we include their integrated line fluxes (Col. 2) and their individual measurements (Cols. 3 and 4). The oxygen abundances estimated for the two knots and the integrated spectrum (i.e., knot 1 + knot 2), 12 + log (O/H) = 8.28 dex, are consistent within the the error of the Marino et al. (2013) calibration (0.2 dex), which is also consistent with the BCD classification for this galaxy.
The two visible knots in the Hα image of FS90-106 (labelled 1 and 2 in the right-hand panel of Fig. 1) could not be disentangled spectroscopically with GMOS. We measured the lines from the integrated spectrum, corresponding to the sum of the emission from knots 1 and 2 (see Col. 5 of Table 3), and found 12 + log (O/H) = 8.25 dex, which is also consistent with the BCD classification for this galaxy.
For FS90-147, four bright knots were resolved with GMOS in the two slit configurations. From the two bright knots aligned along slit A (labelled A1 and A2 in the middle right panel of Fig. 1), only A1 could be spectroscopically resolved, and it shows 12 + log (O/H) = 8.17 dex. For the other pair aligned along slit B (knots B1 and B2), we derived very similar oxygen abundances: 12 + log (O/H) = 8.20 for knot B1 and 12 + log (O/H) = 8.21 dex for knot B2. We could also extract the spectrum of a fainter emission knot within slit B (marked as B3) for which we obtained 12 + log (O/H) = 8.20 dex. Considering the typical uncertainty of 0.2 dex from the calibration used in this work, we fouud no evidence of a significant metallicity variation across the galaxy FS90-147B. The abundance of this galaxy, averaged to 12 + log (O/H) = 8.20 dex based on the measurements for the individual knots, that agrees with the metallicity values found for most of BCDs.
5.3. Fundamental relations
We study the classic two-dimensional correlations based on the physical and chemical data of our small star-forming sample in Antlia, with the aim of comparing to past similar samples in the Local Volume, Virgo, Fornax, and Hydra clusters (Vaduvescu et al. 2005; 2006; 2007; 2008; 2011).
To calculate absolute magnitudes, we used the following cluster distance modulus: DM = 32.73 mag for Antlia (Dirsch et al. 2003), DM = 31.51 mag for Fornax (Blakeslee et al. 2009), DM = 33.31 mag for Hydra (Jensen et al. 1999), and DM = 30.62 mag for most galaxies in Virgo (Freedman et al. 2001 – based on Cepheids), except VCC 24 and VCC 144, for which we adopt DM = 32.53 mag from Gavazzi et al. (2005), who found them to be members of the most distant Virgo clouds W and M. For the LV objects, we adopt literature distances derived according to best estimators (mostly Cepheids and TRGB methods), all quoted with references in our past papers. For each object, we use the galactic extinction in KS taken from NED, although this involved very small corrections.
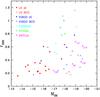 |
Fig. 5 Sech scale radius r0SK (measured in kpc) versus sech absolute magnitude MSK for the star-forming dwarfs in the Local Volume, Virgo, Fornax, Hydra, and Antlia samples. The distribution is quite widespread and includes the Antlia galaxies. |
Figure 4 plots the central surface brightness μ0SK (in magnitudes per square arcsec) versus the absolute magnitude MSK, both measured based on the KS sech fit, which is known to quantify the old extended light component of the star-forming galaxies better. The well known linear correlation holds for all five Antlia galaxies (plotted with crosses and labelled in magenta), towards the bright luminosity (BCD) end. Figure 5 shows the scale radius r0SK (derived from the sech fit and measured in kpc) versus the sech absolute magnitude MSK. The plot shows a trend, but the spread is larger for cluster objects compared with the LV, with the Antlia objects spreading around the composite sample. Figure 6 plots the isophotal radius r22K (based on the sech model and measured in kpc) versus the sech absolute magnitude MSK. The known relation holds for both LV and cluster objects including Antlia, with larger galaxies being brighter. Figure 7 presents the oxygen abundance 12 + log (O/H) versus the sech absolute magnitude MSK. The known trend holds for both LV and cluster objects including Antlia, testing whether brighter objects are more chemically evolved.
Unfortunately, no galaxy was observed in radio yet for deriving HI line widths W20, and also the 21 cm fluxes are unknown for the entire sample, thus we cannot check the dwarf fundamental plane (FP, Vaduvescu et al. 2008; McCall et al. 2012), neither the mass – metallicity relation, nor the closed box evolution (Vaduvescu et al. 2007).
6. Conclusions
Five star-forming dwarf galaxy candidates were selected from the scarce literature in the Antlia cluster with the aim of continuing our studies of physical and chemical properties of BCDs and dIs in the Local Volume and other nearby clusters (Virgo, Fornax, and Hydra). Deep Hα and R imaging was obtained for these targets in arcsec seeing Band 3 conditions using Gemini South with the GMOS-S camera.
Three galaxies (FS90-98, FS90-106, FS90-147) out of five show Hα emission and a few knots. From our GMOS spectroscopic observations, we confirm that these three galaxies are members of the Antlia cluster. We derive the oxygen abundance for these objects and find values that fall in the metallicity range derived for most of the BCDs. Shallower archival VHS KS images for all five targets were reduced and studied further, showing KS surface-brightness profile fits consistent with BCD classification, namely a sech law to account for the extended component plus a Gaussian to fit the inner outburst.
FS90-155 and FS90-319 could not be confirmed as star-forming cluster candidates, and their membership status remains uncertain. FS90-155 shows some flocculent structure in both R and KS images resembling spiral arm structures and showing no Hα emission. FS90-319 presents a flat flux distribution in its inner region that has one non-central diffuse emission visible in both visible and NIR and no Hα emission, so their membership status remains uncertain.
Two-dimensional physical and chemical relations were studied using KS sech data for the whole Antlia sample to probe wheather known relations (specifically the size-luminosity and luminosity-metallicity) are followed by dwarfs in the LV and the Virgo, Fornax and Hydra clusters. Future studies could benefit from deeper NIR imaging and radio data in the aim to compare star-forming dwarf formation and galaxy evolution in the nearby Universe.
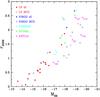 |
Fig. 6 Sech isophotal semi-major axis r22SK (measured in kpc) versus sech absolute magnitude MSK for the star-forming dwarfs in the Local Volume, Virgo, Fornax, Hydra, and Antlia samples. The well known trend is probed by the Antlia galaxies. |
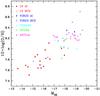 |
Fig. 7 Oxygen abundance 12 + log (O/H) versus sech absolute magnitude MSK for the star-forming dwarfs in the Local Volume, Virgo, Fornax, Hydra, and Antlia samples. The well known linear trend is probed by three Antlia galaxies with available spectra. |
IRAF is distributed by the National Optical Astronomical Observatories, which are operated by the Association of Universities for Research in Astronomy, Inc., under cooperative agreement with the National Science Foundation.
Acknowledgments
OV thanks to the Gemini TACs for the time allocation at Gemini South Observatory (programmes GS-2010A-Q-51 and GS-2012A-Q-59) which is operated by the Association of Universities for Research in Astronomy, Inc., under a cooperative agreement with the NSF on behalf of the Gemini partnership: the National Science Foundation (United States), the Science and Technology Facilities Council (United Kingdom), the National Research Council (Canada), CONICYT (Chile), the Australian Research Council (Australia), Ministerio da Ciencia e Tecnologia (Brazil) and Ministerio de Ciencia, Tecnologia e Innovacion Productiva (Argentina). VISTA VHS raw data was obtained from the ESO Science Archive Facility under request number 72524. CK has been funded by the project AYA2010-21887-C04-01 from the Spanish PNAYA. LPB, AVSC and JPC acknowledge financial support from Consejo Nacional de Investigaciones Científicas y Técnicas de la República Argentina, Agencia Nacional de Promoción Científica y Tecnológica (PICT 2010-0410), and Universidad Nacional de La Plata (Argentina). This research has made use of the NASA/IPAC Extragalactic Database (NED) which is operated by the Jet Propulsion Laboratory, California Institute of Technology, under contract with the National Aeronautics and Space Administration. Our work used IRAF, a software package distributed by the National Optical Astronomy Observatory, which is operated by the Association of Universities for Research in Astronomy (AURA) under cooperative agreement with the National Science Foundation. This research has made use of SAOImage DS9, developed by Smithsonian Astrophysical Observatory. Acknowledgements are due to Prof. Marshall L. McCall (York University, Canada) and Prof. Tom Richtler (University de Concepción, Chile) who took part in our Gemini proposals and contributed to the sample selection. We thank the anonymous referee whose feedback helped us to improve the paper.
References
- Amorín, R., Alfonso, J., Aguerri, J. A. L., Muñoz-Tuñón, C., & Cairós, L. M. 2009, A&A, 501, 75 [NASA ADS] [CrossRef] [EDP Sciences] [Google Scholar]
- Asplund, M., Grevesse, N., Sauval, A. J., & Scott, P. 2009, ARA&A, 47, 481 [NASA ADS] [CrossRef] [Google Scholar]
- Bassino, L. P., Richtler, T., & Dirsch, B. 2008, MNRAS, 386, 1145 [NASA ADS] [CrossRef] [Google Scholar]
- Bell, E. F., Zheng, X. Z., Papovich, C., et al. 2007, ApJ, 663, 834 [NASA ADS] [CrossRef] [Google Scholar]
- Blakeslee, J. P., Jordán, A., Mei, S., et al. 2009, ApJ, 694, 556 [NASA ADS] [CrossRef] [Google Scholar]
- Cairós, L. M., Vílchez, J. M., González-Pérez, J. N., & Iglesias-Páramo, C. N. 2001, ApJS, 133, 321 [NASA ADS] [CrossRef] [Google Scholar]
- Cairós, L. M., Caon, N., García-Lorenzo, B., Vílchez, J. M., & Muñoz-Tuñón, C. 2002, ApJ, 577, 164 [NASA ADS] [CrossRef] [Google Scholar]
- Cairós, L. M., Caon, N., Papaderos, P., et al. 2009, ApJ, 707, 1676 [NASA ADS] [CrossRef] [Google Scholar]
- Cairós, L. M., Caon, N., Zurita, C., et al. 2010, A&A, 520, A90 [NASA ADS] [CrossRef] [EDP Sciences] [Google Scholar]
- Caso, J. P., Bassino, L. P., Richtler, T., Smith Castelli, A. V., & Faifer, F. R. 2013, MNRAS, 430, 1088 [NASA ADS] [CrossRef] [Google Scholar]
- Castellanos, M. 2000, Ph.D. Thesis, Universidad Autonoma de Madrid [Google Scholar]
- Dirsch, B., Richtler, T., & Bassino, L. P. 2003, A&A, 408, 929 [NASA ADS] [CrossRef] [EDP Sciences] [Google Scholar]
- Ferguson, H. C., & Sandage 1990, AJ, 100, 1 [NASA ADS] [CrossRef] [Google Scholar]
- Freedman, W. L., Madore, B. F., Gibson, B. K., et al. 2001, ApJ, 553, 47 [NASA ADS] [CrossRef] [Google Scholar]
- Gavazzi, G., Boselli, A., Donati, A., Franzetti, P., & Scodeggio, M. 2003, A&A, 400, 451 [NASA ADS] [CrossRef] [EDP Sciences] [Google Scholar]
- Gavazzi, G., Boselli, A., van Driel, W., & O’Neil, K. 2005, A&A, 429, 439 [NASA ADS] [CrossRef] [EDP Sciences] [Google Scholar]
- Gil de Paz, A., & Madore, B. F. 2005, ApJS, 156, 345 [NASA ADS] [CrossRef] [EDP Sciences] [Google Scholar]
- Gil de Paz, A., Madore, B. F., & Pevunova, O. 2003, ApJS, 147, 29 [NASA ADS] [CrossRef] [Google Scholar]
- Hook, I. M., Jørgensen, I., Allington-Smith, J. R., et al. 2004, PASP, 116, 425 [NASA ADS] [CrossRef] [Google Scholar]
- Hopp, U., & Materne, J. 1985, A&AS, 61, 93 [NASA ADS] [Google Scholar]
- Jensen, J. B., Tonry, J. L., & Luppino, G. A. 1999, ApJ, 510, 71 [NASA ADS] [CrossRef] [Google Scholar]
- Karachentsev, I. D., Makarov, D. I., & Kaisina, E. I. 2013, ApJ, 145, 101 [Google Scholar]
- Kehrig, C., Telles, E., & Cuisinier, F. 2004, AJ, 128, 1141 [NASA ADS] [CrossRef] [Google Scholar]
- Kehrig, C., Vílchez, J. M., Telles, E., Cuisinier, F., & Pérez-Montero, E. 2006, A&A, 457, 477 [NASA ADS] [CrossRef] [EDP Sciences] [Google Scholar]
- Kehrig, C., Vílchez, J. M., Sánchez, S. F., et al. 2008, A&A, 477, 813 [NASA ADS] [CrossRef] [EDP Sciences] [Google Scholar]
- Kehrig, C., Pérez-Montero, E., Vilchez, J. M., et al. 2013, MNRAS, 432, 2731 [NASA ADS] [CrossRef] [Google Scholar]
- Kunth, D., & Ostlin, G. 2000, A&ARv, 10, 1 [NASA ADS] [CrossRef] [Google Scholar]
- Kunth, D., & Sargent, W. L. W. 1986, ApJ, 300, 496 [NASA ADS] [CrossRef] [Google Scholar]
- Lauberts, A. 1982, The ESO/Uppsala Survey of the ESO (B) Atlas (European Southern Observatory) [Google Scholar]
- Lequeux, J., & Viallefond, F. 1980, A&A, 91, 269 [NASA ADS] [Google Scholar]
- Loose, H.-H., & Thuan, T. X. 1986, ApJ, 309, 59 [NASA ADS] [CrossRef] [Google Scholar]
- Marino, R. A., Rosales-Ortega, F. F., Sánchez, S. F., et al. 2013, A&A, 559, A114 [NASA ADS] [CrossRef] [EDP Sciences] [Google Scholar]
- McCall, M. L., Vaduvescu, O., et al. 2012, A&A, 540, A49 [NASA ADS] [CrossRef] [EDP Sciences] [Google Scholar]
- Nakazawa, K., Makishima, K., Fukazawa, Y., & Tamura, T. 2000, PASJ, 52, 623 [NASA ADS] [CrossRef] [Google Scholar]
- Noeske, K. G., Papaderos, P., Cairós, L. M., & Fricke, K. J. 2003, A&A, 410, 481 [NASA ADS] [CrossRef] [EDP Sciences] [Google Scholar]
- Noeske, K. G., Papaderos, P., Cairós, L. M., & Fricke, K. J. 2005, A&A, 429, 115 [NASA ADS] [CrossRef] [EDP Sciences] [Google Scholar]
- Pagel, B. E. J., Edmunds, M. G., Blackwell, D. E., Chun, M. S., & Smith, G. 1979, MNRAS, 189, 95 [NASA ADS] [CrossRef] [Google Scholar]
- Papaderos, P., Loose, H.-H., Thuan, T. X., & Fricke, K. J. 1996, A&AS, 120, 207 [NASA ADS] [CrossRef] [EDP Sciences] [Google Scholar]
- Pilyugin, L. S., Vilchez, J. M., & Thuan, T. X. 2010, ApJ, 720, 1738 [NASA ADS] [CrossRef] [Google Scholar]
- Sargent, W. L. W., & Searle, L. 1970, ApJ, 162, L155 [NASA ADS] [CrossRef] [Google Scholar]
- Sánchez-Janssen, R., Amorín, R., García-Vargas, M., et al. 2013, A&A, 554, A20 [NASA ADS] [CrossRef] [EDP Sciences] [Google Scholar]
- Shaw, R. A., & Dufour, R. J. 1994, Astronomical Data Analysis Software and Systems III, eds. D. R. Crabtree, R. J. Hanisch, & J. Barnes, ASP Conf. Ser., 61, 327 [Google Scholar]
- Smith Castelli, A. V., Bassino, L. P., Richtler, T., et al. 2008a, MNRAS, 386, 2311 [NASA ADS] [CrossRef] [Google Scholar]
- Smith Castelli, A. V., Faifer, F. R., Richtler, T., & Bassino, L. P. 2008b, MNRAS, 391, 685 [NASA ADS] [CrossRef] [Google Scholar]
- Smith Castelli, A. V., Cellone, S. A., Faifer, F. R., et al. 2012, MNRAS, 419, 2472 [NASA ADS] [CrossRef] [Google Scholar]
- Thuan, T. X., & Martin, G. E. 1981, ApJ, 247, 823 [NASA ADS] [CrossRef] [Google Scholar]
- Vaduvescu, O., & McCall, M. L. 2008, A&A, 487, 147 [NASA ADS] [CrossRef] [EDP Sciences] [Google Scholar]
- Vaduvescu, O., McCall, M., Richer, M., & Fingerhut, R. 2005, AJ, 130, 1593 [NASA ADS] [CrossRef] [Google Scholar]
- Vaduvescu, O., Richer, M., & McCall, M. 2006, AJ, 131, 1335 [Google Scholar]
- Vaduvescu, O., McCall, M. L., & Richer, M. G. 2007, AJ, 134, 604 [NASA ADS] [CrossRef] [Google Scholar]
- Vaduvescu, O., Kehrig, C., Vilchez, J. M., & Unda-Sanzana, E. 2011, A&A, 533, A65 [NASA ADS] [CrossRef] [EDP Sciences] [Google Scholar]
- Zacharias, N., Amorín, R., García-Vargas, M., et al. 2013, AJ, 145, 44 [NASA ADS] [CrossRef] [EDP Sciences] [Google Scholar]
- Zhao, Y., Gao, Y., & Gu, Q. 2010, ApJ, 710, 663 [NASA ADS] [CrossRef] [Google Scholar]
- Zhao, Y., Gao, Y., & Gu, Q. 2013, ApJ, 764, 44 [NASA ADS] [CrossRef] [Google Scholar]
All Tables
Observing log of the star-forming dwarf galaxies in the Antlia cluster observed with Gemini South and VISTA.
Physical parameters of the galaxies observed in KS and R bands in Antlia cluster.
Reddening-corrected line fluxes relative to F(Hβ) = 1 for the sample of Antlia galaxies.
All Figures
|
Fig. 1 Continuum R G0326 (left panel, FOV 1′ × 1′), Hα G0336 (middle panel, FOV 0.5′ × 0.5′), and Hα images (right panel, FOV 0.5′ × 0.5′) of the Antlia dwarf star-forming candidates observed with GMOS at Gemini South. The 1′′ GMOS slit and the two slits A and B used for FS90-147 are drawn in white in the right column plots, including most of the net Hα emission knots. |
| In the text | |
|
Fig. 2 VISTA VHS KS images (left panel, FOV 1′ × 1′, normal orientation) and surface brightness profiles in KS and R of the five Antlia BCD candidates. For the KS fits, we plot the sech component (continuous thick line), the Gaussian component (dashed line), and the sum of the two (continuous thin line). The colour profiles R − KS are plotted at the bottom of each graph. |
| In the text | |
|
Fig. 3 Blue and red spectra (shown above and below), in units of 10-15 erg s-1 cm-2 Å-1, of the star-forming candidates in our Antlia cluster: FS90-98 (integrating knots 1 and 2), FS90-106 (knot 1), FS90-147A (integrated knots A1 and A2), and FS90-147B (integrated knots B1 and B2). |
| In the text | |
|
Fig. 4 Sech central surface brightness μ0SK (mag arcsec-2) versus sech absolute magnitude MSK for the star-forming dwarfs in the Local Volume, Virgo, Fornax, Hydra, and Antlia samples. The well known linear trend is probed by the Antlia galaxies. |
| In the text | |
|
Fig. 5 Sech scale radius r0SK (measured in kpc) versus sech absolute magnitude MSK for the star-forming dwarfs in the Local Volume, Virgo, Fornax, Hydra, and Antlia samples. The distribution is quite widespread and includes the Antlia galaxies. |
| In the text | |
|
Fig. 6 Sech isophotal semi-major axis r22SK (measured in kpc) versus sech absolute magnitude MSK for the star-forming dwarfs in the Local Volume, Virgo, Fornax, Hydra, and Antlia samples. The well known trend is probed by the Antlia galaxies. |
| In the text | |
|
Fig. 7 Oxygen abundance 12 + log (O/H) versus sech absolute magnitude MSK for the star-forming dwarfs in the Local Volume, Virgo, Fornax, Hydra, and Antlia samples. The well known linear trend is probed by three Antlia galaxies with available spectra. |
| In the text | |
Current usage metrics show cumulative count of Article Views (full-text article views including HTML views, PDF and ePub downloads, according to the available data) and Abstracts Views on Vision4Press platform.
Data correspond to usage on the plateform after 2015. The current usage metrics is available 48-96 hours after online publication and is updated daily on week days.
Initial download of the metrics may take a while.