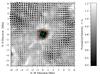
Fig. 9
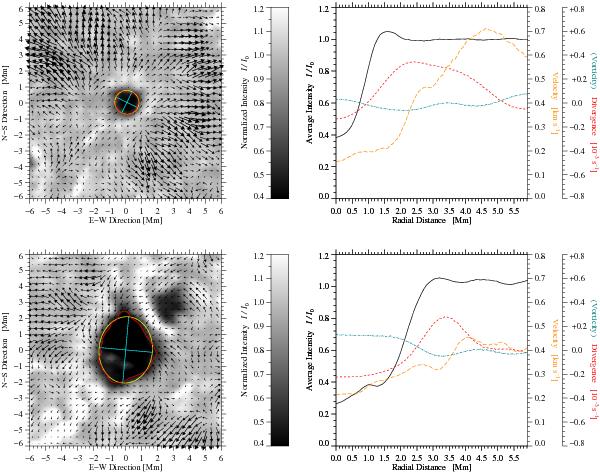
Time-averaged (60-min) G-band images (left) of an isolated pore (top) observed on 2007 February 3 and a residual pore (bottom) observed on 2006 December 7. The arrows indicate magnitude and direction of the horizontal proper motions. Arrow with the length of the grid spacing indicate a speed of 0.5 km s-1. Azimuthally averaged profiles (right) are presented for the time-averaged G-band intensity (solid), the horizontal flow velocities (long-dashed), the divergence (dashed), and the vorticity (dash-dotted).
Current usage metrics show cumulative count of Article Views (full-text article views including HTML views, PDF and ePub downloads, according to the available data) and Abstracts Views on Vision4Press platform.
Data correspond to usage on the plateform after 2015. The current usage metrics is available 48-96 hours after online publication and is updated daily on week days.
Initial download of the metrics may take a while.