Free Access
Fig. 7
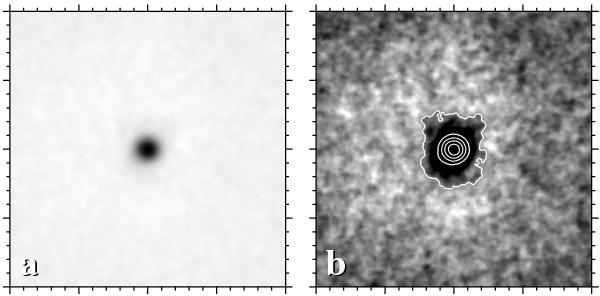
The average of 742 single G-band images containing isolated pores is displayed between a) Imin = 0.54 I0 and Imax = 1.03 I0 and b) in the range (1.00 ± 0.02) I0. The white contour lines correspond to intensities from 0.6–1.0 I0 in increments of 0.1 I0. Major tick marks are separated by 5 Mm.
Current usage metrics show cumulative count of Article Views (full-text article views including HTML views, PDF and ePub downloads, according to the available data) and Abstracts Views on Vision4Press platform.
Data correspond to usage on the plateform after 2015. The current usage metrics is available 48-96 hours after online publication and is updated daily on week days.
Initial download of the metrics may take a while.