Fig. 5
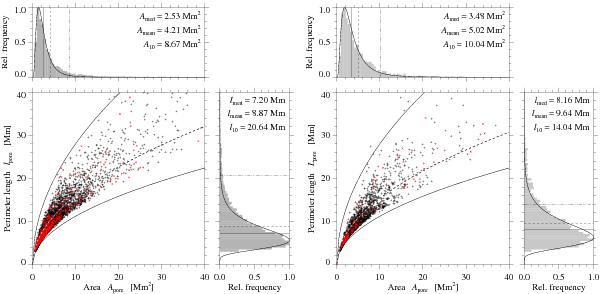
Scatter plots of perimeter length lpore vs. area Apore for single (left) and time-averaged (right) G-band images, which also include the respective frequency distributions. Red symbols “×” mark isolated pores. The lower envelope (solid) of the scatter plots refers to perfectly circular pores (α = 1 in Eqn. 1), while the upper envelope (solid) is given by a scaling factor of α = 2.5. Non-linear least squares fits (dashed) using Eq. (1) lead to scaling factors of α = 1.43 and 1.37 for single and time-averaged G-band images, respectively. Median, mean, and 10th percentile of the frequency distributions (light gray bars) are given by solid, dashed, and dash-dotted lines, respectively. Quantitative values of the measures are specified in the panels for perimeter lengths lpore and areas Apore. Log-normal frequency distributions (solid) properly fit the histograms.
Current usage metrics show cumulative count of Article Views (full-text article views including HTML views, PDF and ePub downloads, according to the available data) and Abstracts Views on Vision4Press platform.
Data correspond to usage on the plateform after 2015. The current usage metrics is available 48-96 hours after online publication and is updated daily on week days.
Initial download of the metrics may take a while.